

DAX, Nikkei +18 Global Market Levels: Oct 9th Trade Plan Plus Charts
Support, resistance and pivot levels for SPY, ES, QQQ, NQ and 19 stock markets across Asia, Europe and the Americas ahead of the October 9th session, plus how the last session's levels traded.
Little Bird Trading is in 15+ languages. View this report in:
Deutsch · 日本語 · Español (España) · Español · 한국어 · 简体中文 · हिन्दी · Français · Português (Brasil) · Português (Portugal) · 繁體中文 · Italiano · Nederlands · Svenska
MyLinedChart works however you get to a trade: AI-Assisted, Discretionary, Quant, or Macro. Export your lines, levels plus the whole chart as XLSX, JSON, or CSV. Or, let AI do all the work for you.
Here’s an overview of how MyLinedChart compares to TradingView and TrendSpider. Available on Windows, Apple and Android.
Looking for a pro to build your trading workflows? Reach out on Upwork.
Get each market's levels in real time as they're posted. Sign up on Little Bird Trading.
US
A recap of how the October 8th trading session and levels played out
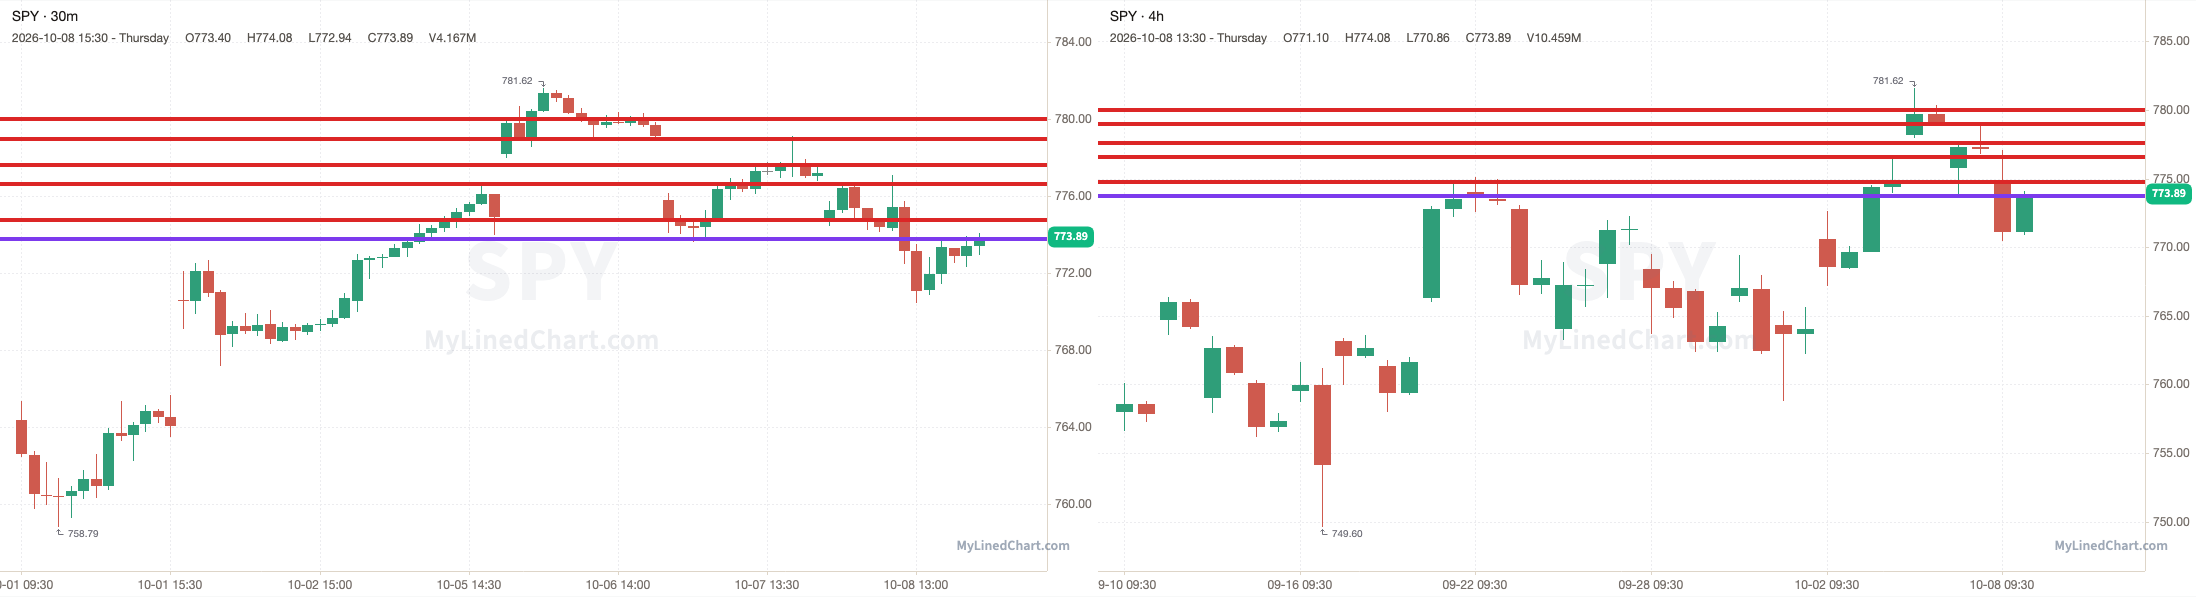
SPY opened at 774.87, stayed under the 777.62 pivot and dropped to tag 773.75, with a low of 770.43, then ended up closing at 773.89. SPY finished down 0.13% intraday and down 0.42% overall.
October 8th session levels:
All listed levels: 773.75, 774.75, 776.60, 777.62, 778.96, 779.99
Resistance above: 777.62, 778.96, 779.99
Support below: 776.60, 774.75, 773.75
Nearest pivot: 777.62
Above 777.62 → 778.96 next
Lose 776.60 → 774.75 next
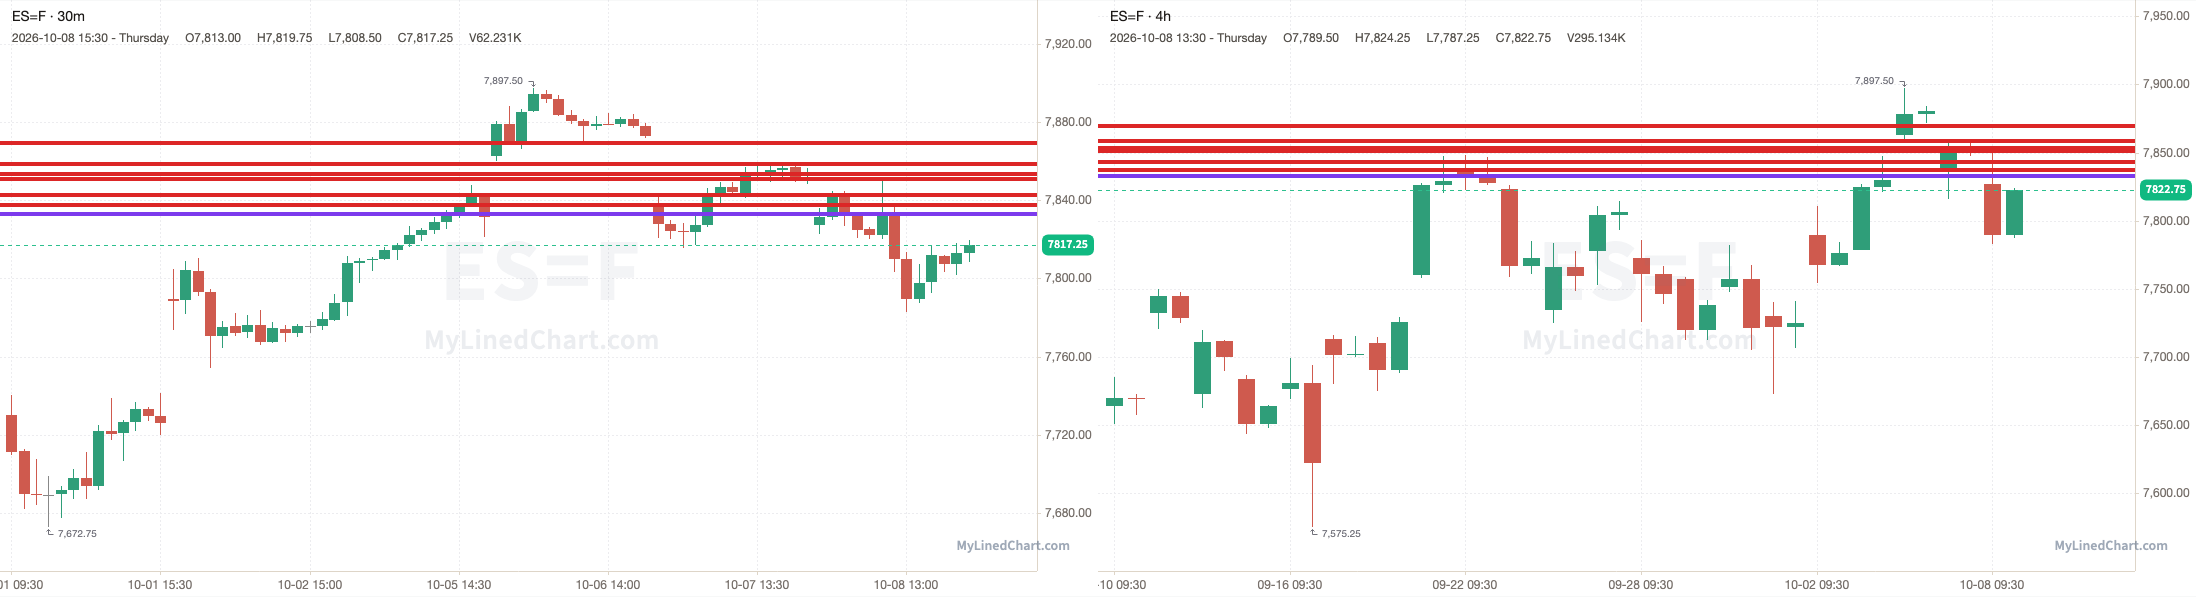
ES opened at 7827.25, stayed under the 7851 pivot and dropped to a low of 7783, then ended up closing at 7822.75. ES finished down 0.06% intraday and down 0.35% overall.
October 8th session levels:
All listed levels: 7833, 7837.50, 7842.75, 7851, 7853.25, 7858.50, 7869.50
Resistance above: 7851, 7853.25, 7858.50, 7869.50
Support below: 7842.75, 7837.50, 7833
Nearest pivot: 7851
Above 7851 → 7853.25 next
Lose 7842.75 → 7837.50 next
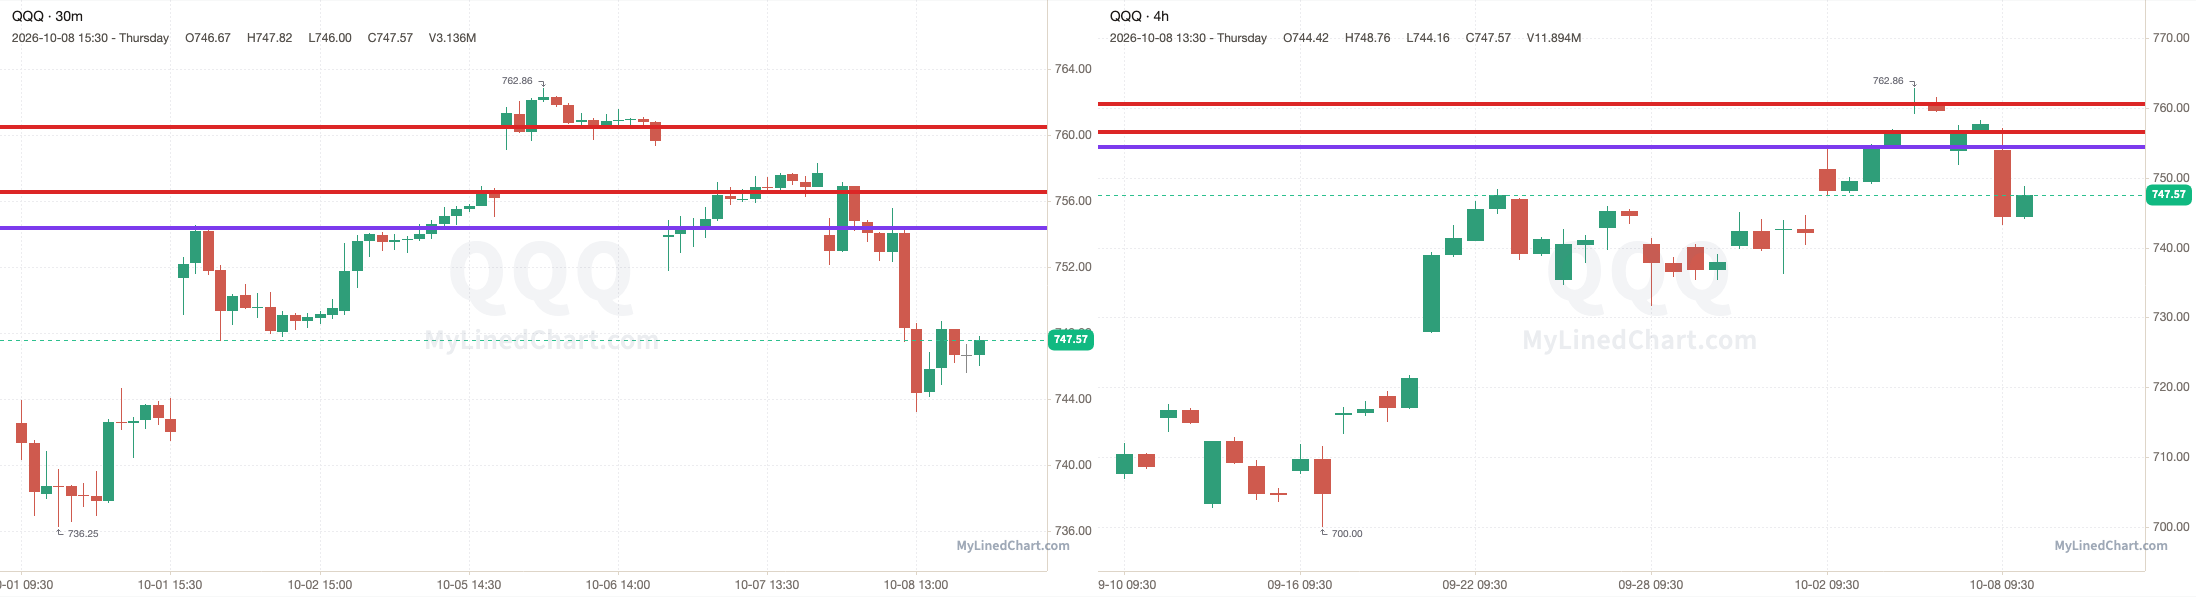
QQQ opened at 753.97, popped above the 756.54 pivot to a high of 757.18, then lost it and dropped to a low of 743.23, then ended up closing at 747.57. QQQ finished down 0.85% intraday and down 1.34% overall.
October 8th session levels:
All listed levels: 754.35, 756.54, 760.51
Resistance above: 760.51
Support below: 756.54, 754.35
Nearest pivot: 756.54
Above 760.51 → open air
Lose 756.54 → 754.35 next
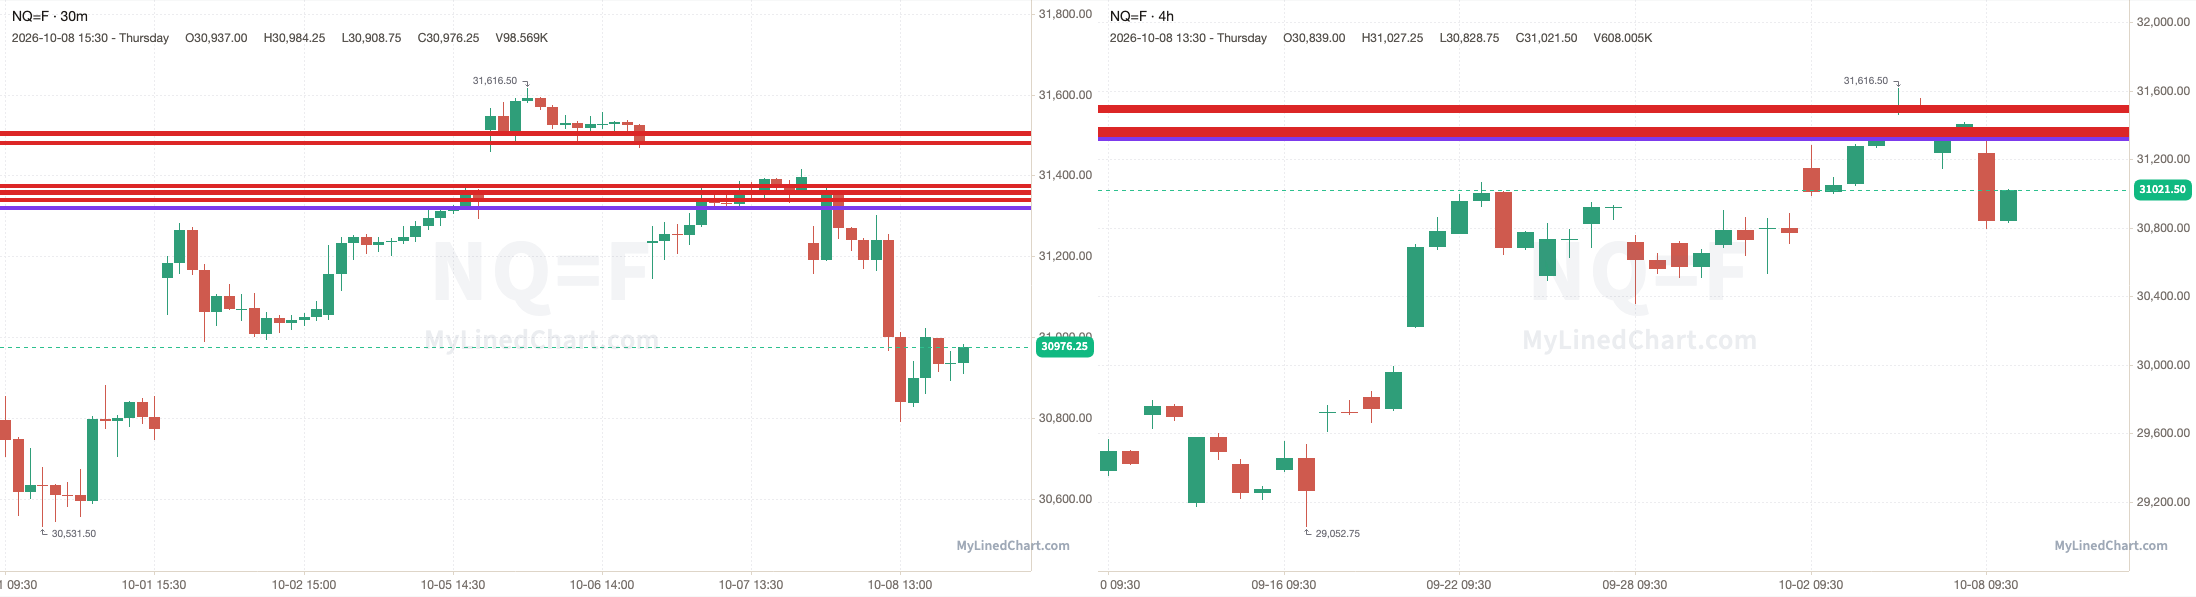
NQ opened at 31234, stayed under the 31373.75 pivot and dropped to a low of 30792, then ended up closing at 31021.50. NQ finished down 0.68% intraday and down 1.22% overall.
October 8th session levels:
All listed levels: 31319.25, 31339, 31356.25, 31360, 31373.75, 31480.75, 31501.50, 31504.25
Resistance above: 31480.75, 31501.50, 31504.25
Support below: 31373.75, 31360, 31356.25, 31339, 31319.25
Nearest pivot: 31373.75
Above 31480.75 → 31501.50 next
Lose 31373.75 → 31360 next
See the SPY, ES, QQQ & NQ trade plan on Little Bird Trading
Asia
Japan: Nikkei 225
A recap of how the October 8th Nikkei 225 trading session and levels played out
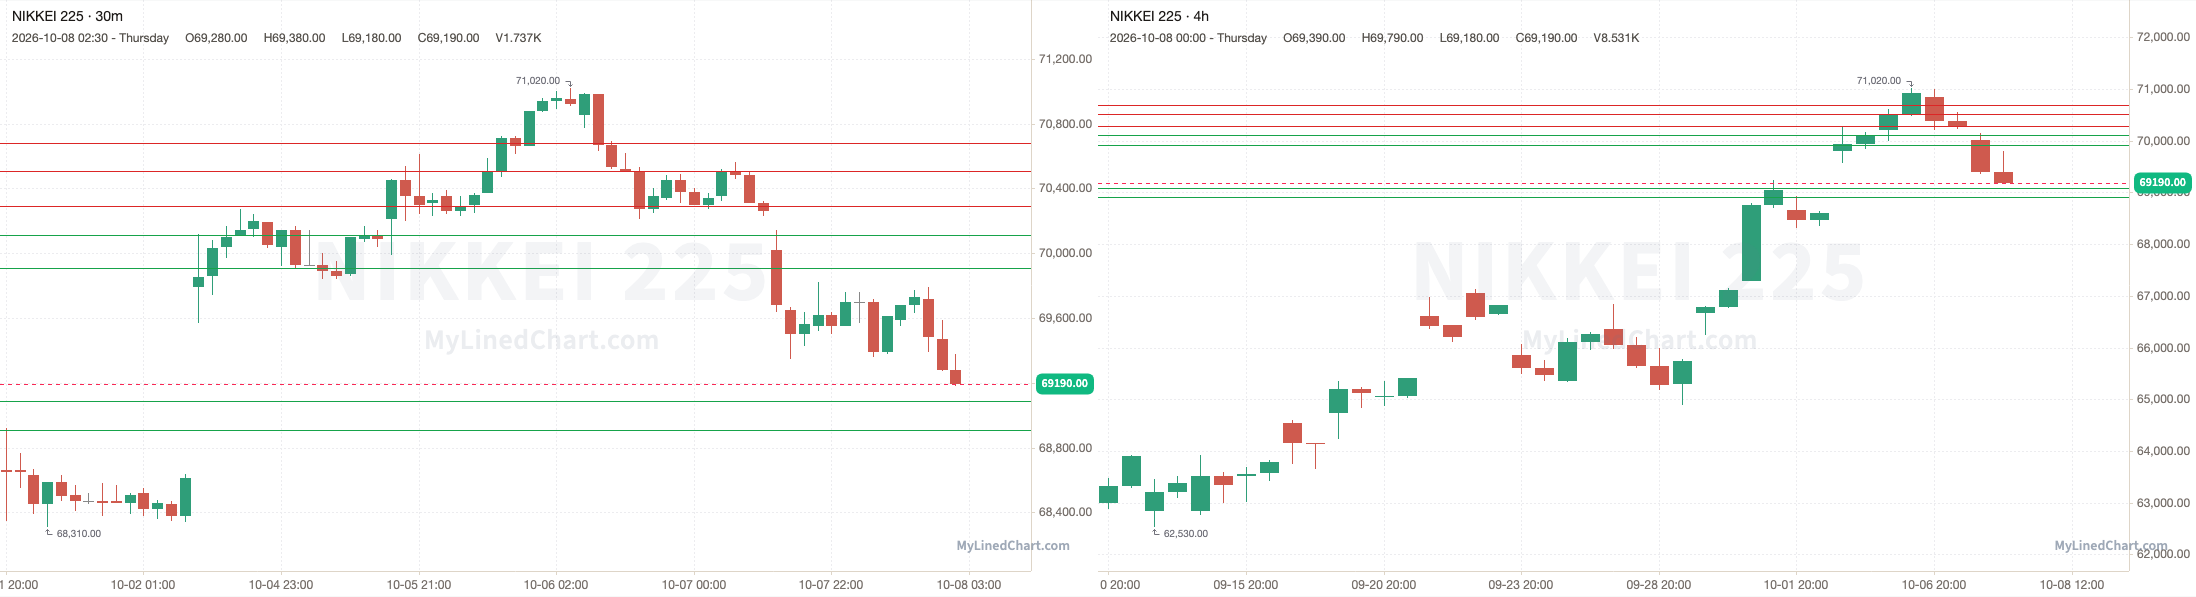
Nikkei 225 opened at 70020, stayed under the 70290 pivot and dropped to tag 69910, with a low of 69180, then ended up closing at 69190. Finishing the trading session down 1.19% intraday.
October 8th session levels:
All listed levels: 68910, 69090, 69910, 70110, 70290, 70510, 70680
Resistance above: 70290, 70510, 70680
Support below: 70110, 69910, 69090, 68910
Nearest pivot: 70290
Above 70290 → 70510 next
Lose 70110 → 69910 next
See the Nikkei 225 trade plan on Little Bird Trading
Korea: KOSPI 200
A recap of how the October 8th KOSPI 200 trading session and levels played out
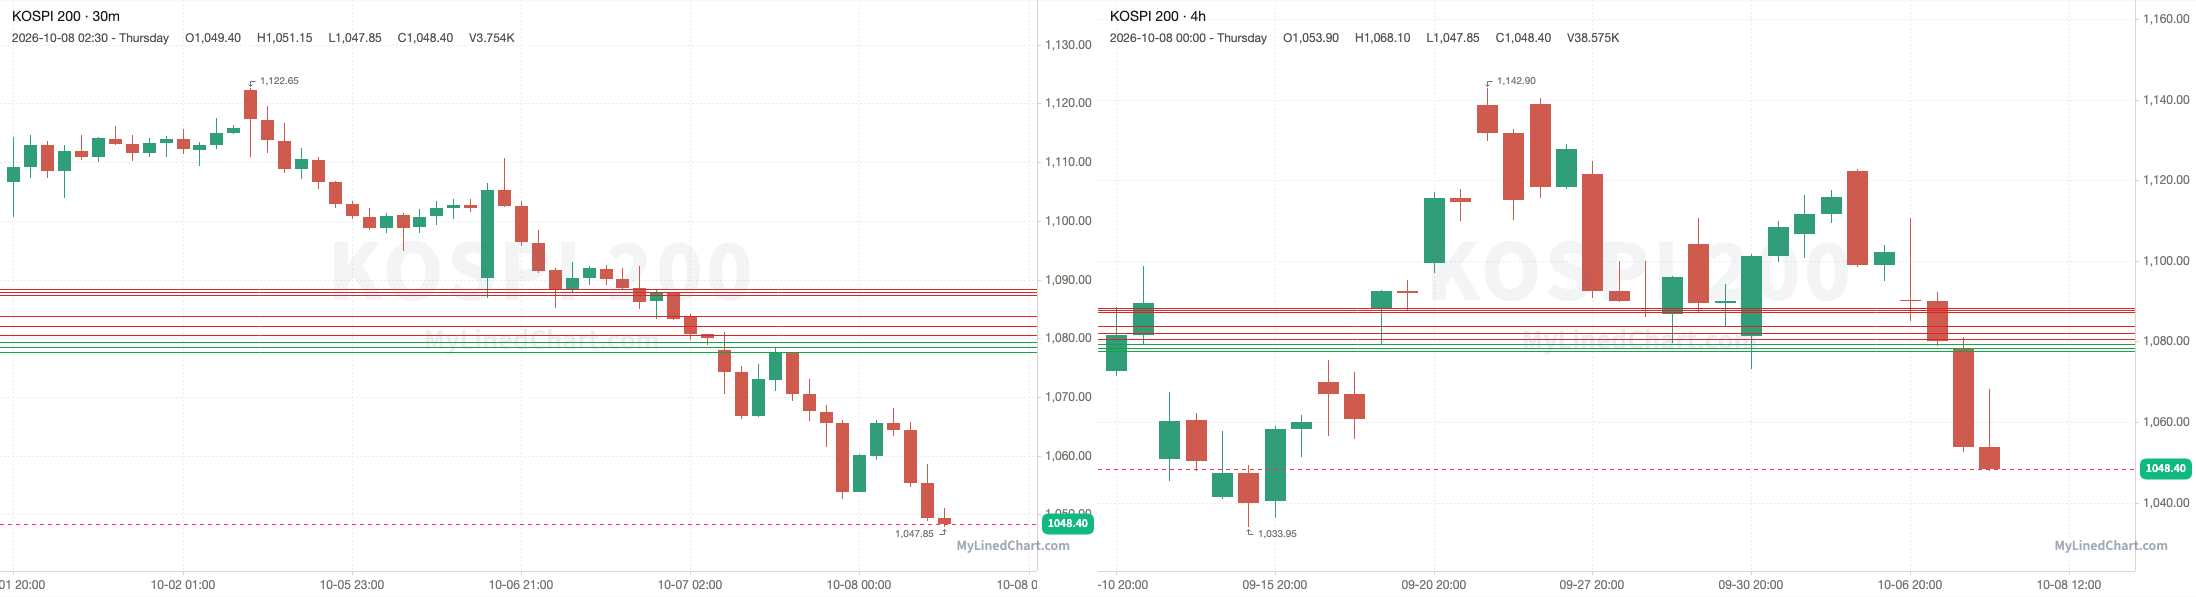
KOSPI 200 opened at 1078, popped above the 1080.55 pivot to a high of 1081.10, then lost it and dropped to tag 1077.60, with a low of 1047.85, then ended up closing at 1048.40. Finishing the trading session down 2.75% intraday.
October 8th session levels:
All listed levels: 1077.60, 1078.45, 1079.45, 1080.55, 1082.05, 1083.85, 1087.30, 1087.80, 1088.35
Resistance above: 1080.55, 1082.05, 1083.85, 1087.30, 1087.80, 1088.35
Support below: 1079.45, 1078.45, 1077.60
Nearest pivot: 1080.55
Above 1080.55 → 1082.05 next
Lose 1079.45 → 1078.45 next
See the KOSPI 200 trade plan on Little Bird Trading
China: FTSE China A50
A recap of how the October 8th FTSE China A50 trading session and levels played out
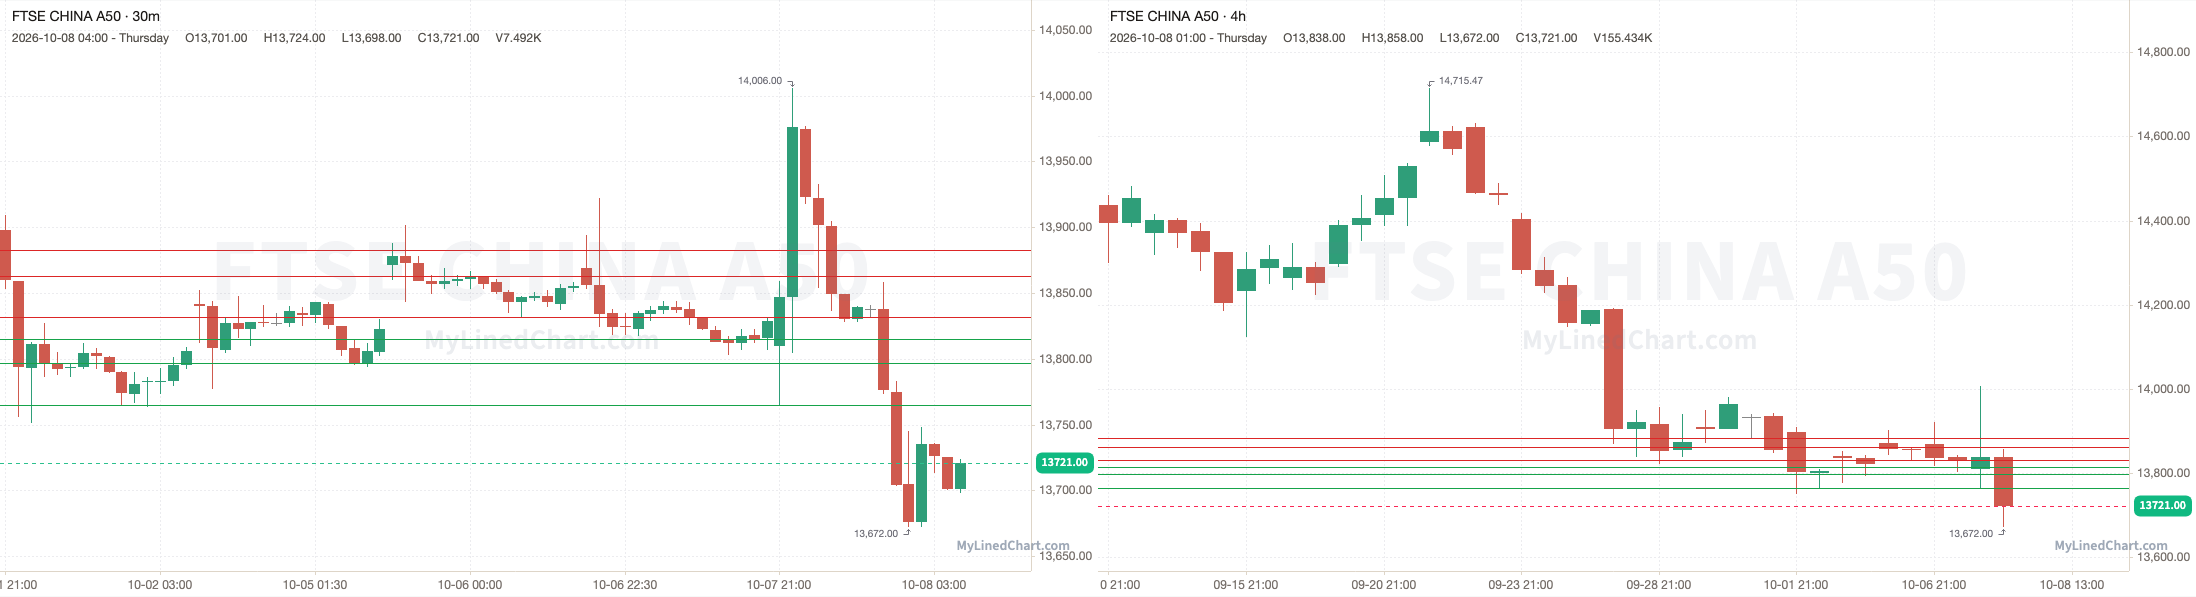
FTSE China A50 opened at 13810, popped above the 13832 pivot to a high of 14006, then lost it and dropped to tag 13765, with a low of 13672, then ended up closing at 13721. Finishing the trading session down 0.64% intraday.
October 8th session levels:
All listed levels: 13765, 13797, 13815, 13832, 13863, 13883
Resistance above: 13832, 13863, 13883
Support below: 13815, 13797, 13765
Nearest pivot: 13832
Above 13832 → 13863 next
Lose 13815 → 13797 next
See the FTSE China A50 trade plan on Little Bird Trading
Hong Kong: Hang Seng
A recap of how the October 8th Hang Seng trading session and levels played out
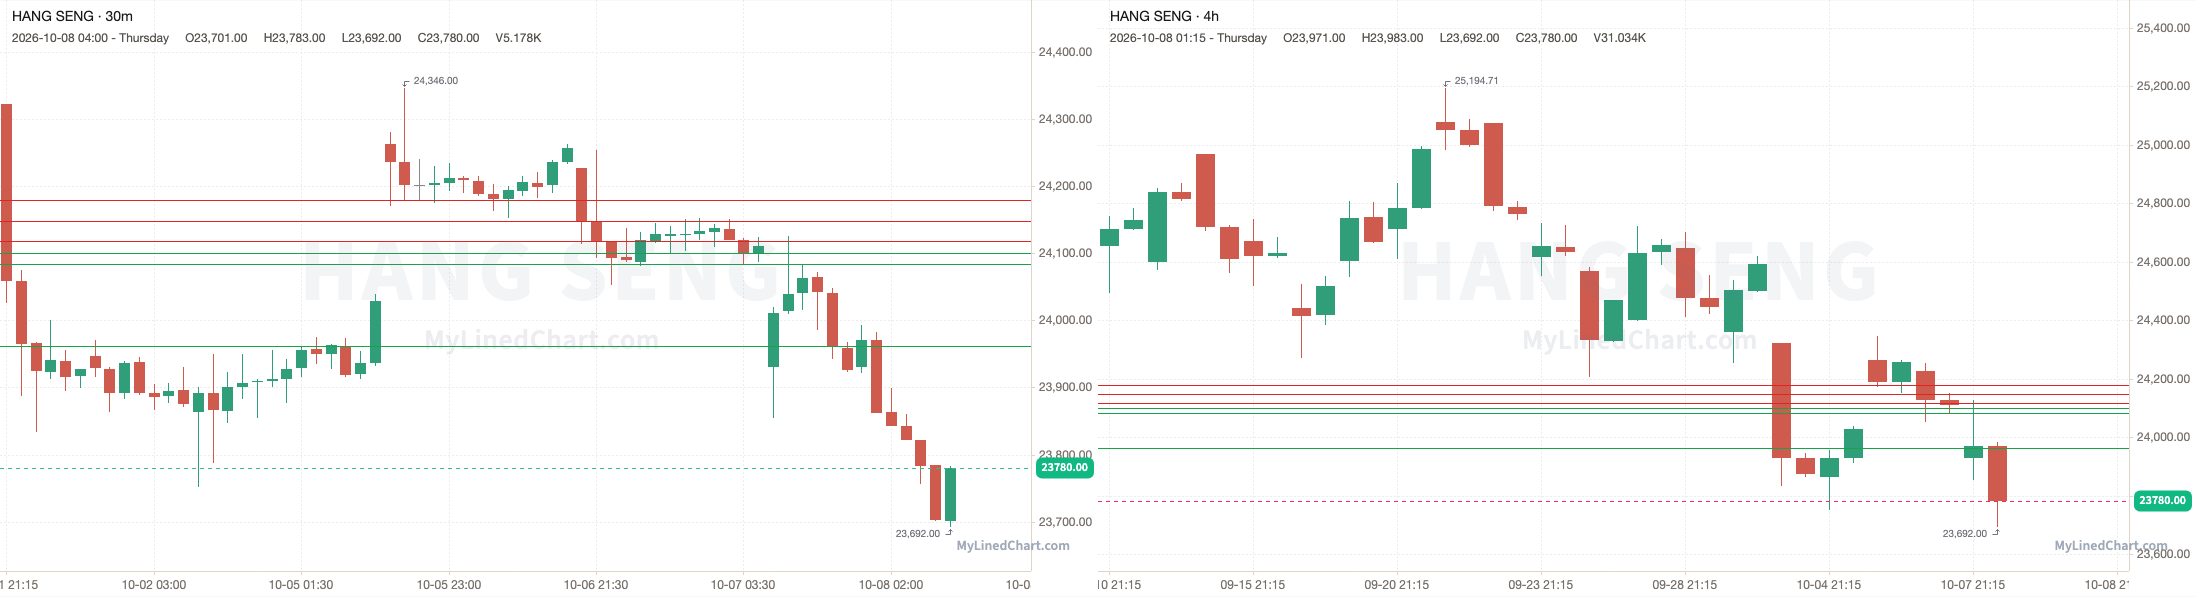
Hang Seng opened at 23930, popped above the 24118 pivot to a high of 24126, then lost it and dropped to a low of 23692, then ended up closing at 23780. Finishing the trading session down 0.63% intraday.
October 8th session levels:
All listed levels: 23961, 24083, 24100, 24118, 24148, 24179
Resistance above: 24118, 24148, 24179
Support below: 24100, 24083, 23961
Nearest pivot: 24118
Above 24118 → 24148 next
Lose 24100 → 24083 next
See the Hang Seng trade plan on Little Bird Trading
Taiwan: FTSE Taiwan
A recap of how the October 8th FTSE Taiwan trading session and levels played out
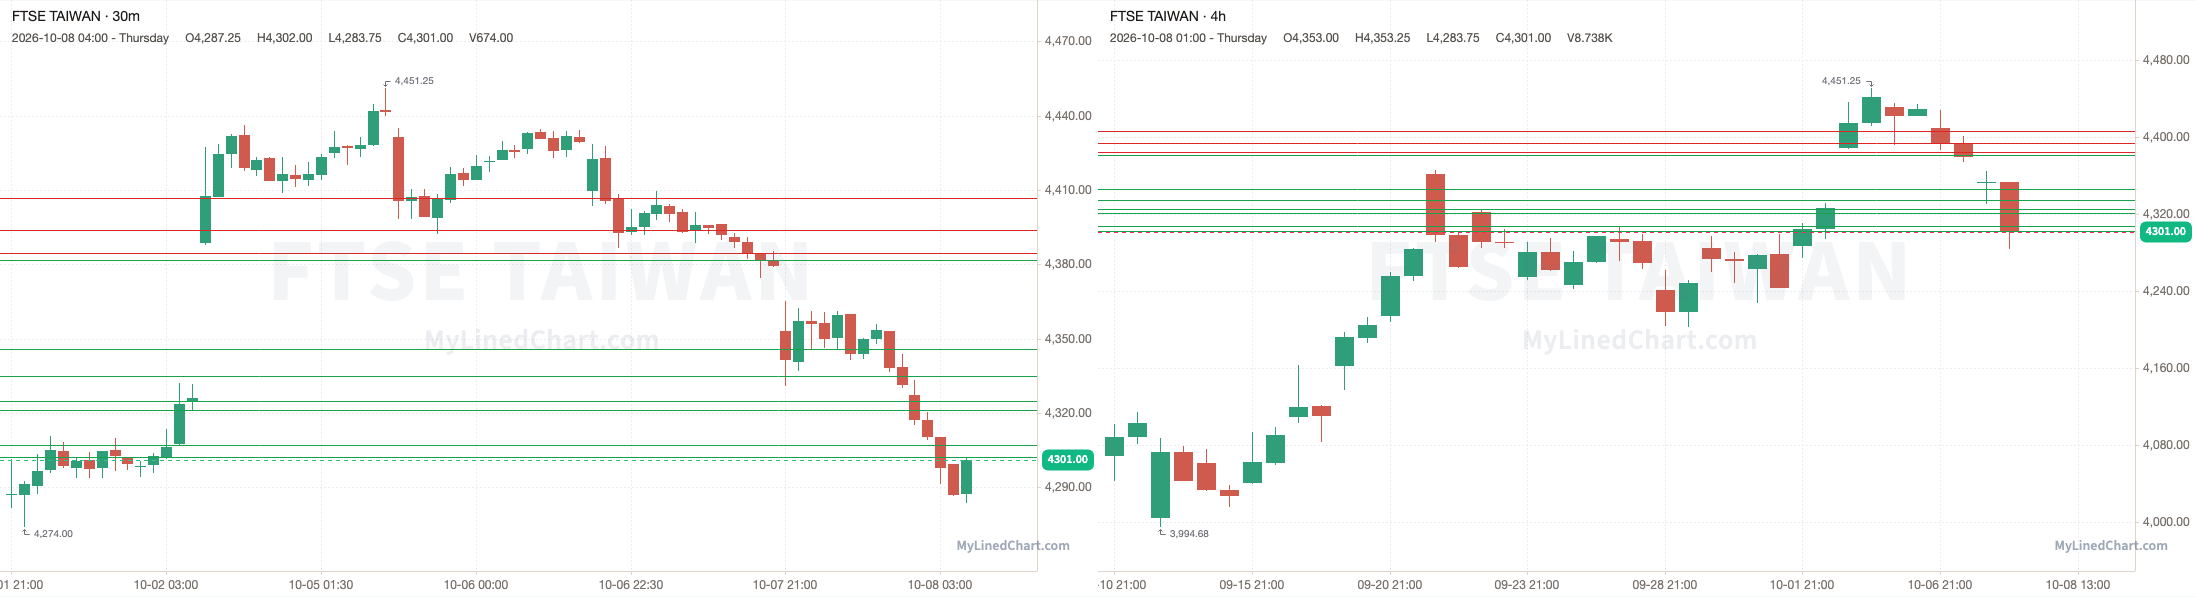
FTSE Taiwan opened at 4353, stayed under the 4384.50 pivot and dropped to tag 4302.25, with a low of 4283.75, then ended up closing at 4301. Finishing the trading session down 1.19% intraday.
October 8th session levels:
All listed levels: 4302.25, 4307.25, 4321.25, 4325, 4335, 4346, 4381.75, 4384.50, 4394, 4406.75
Resistance above: 4394, 4406.75
Support below: 4381.75, 4346, 4335, 4325, 4321.25, 4307.25, 4302.25
Nearest pivot: 4384.50
Above 4394 → 4406.75 next
Lose 4381.75 → 4346 next
See the FTSE Taiwan trade plan on Little Bird Trading
Singapore: MSCI Singapore
A recap of how the October 8th MSCI Singapore trading session and levels played out
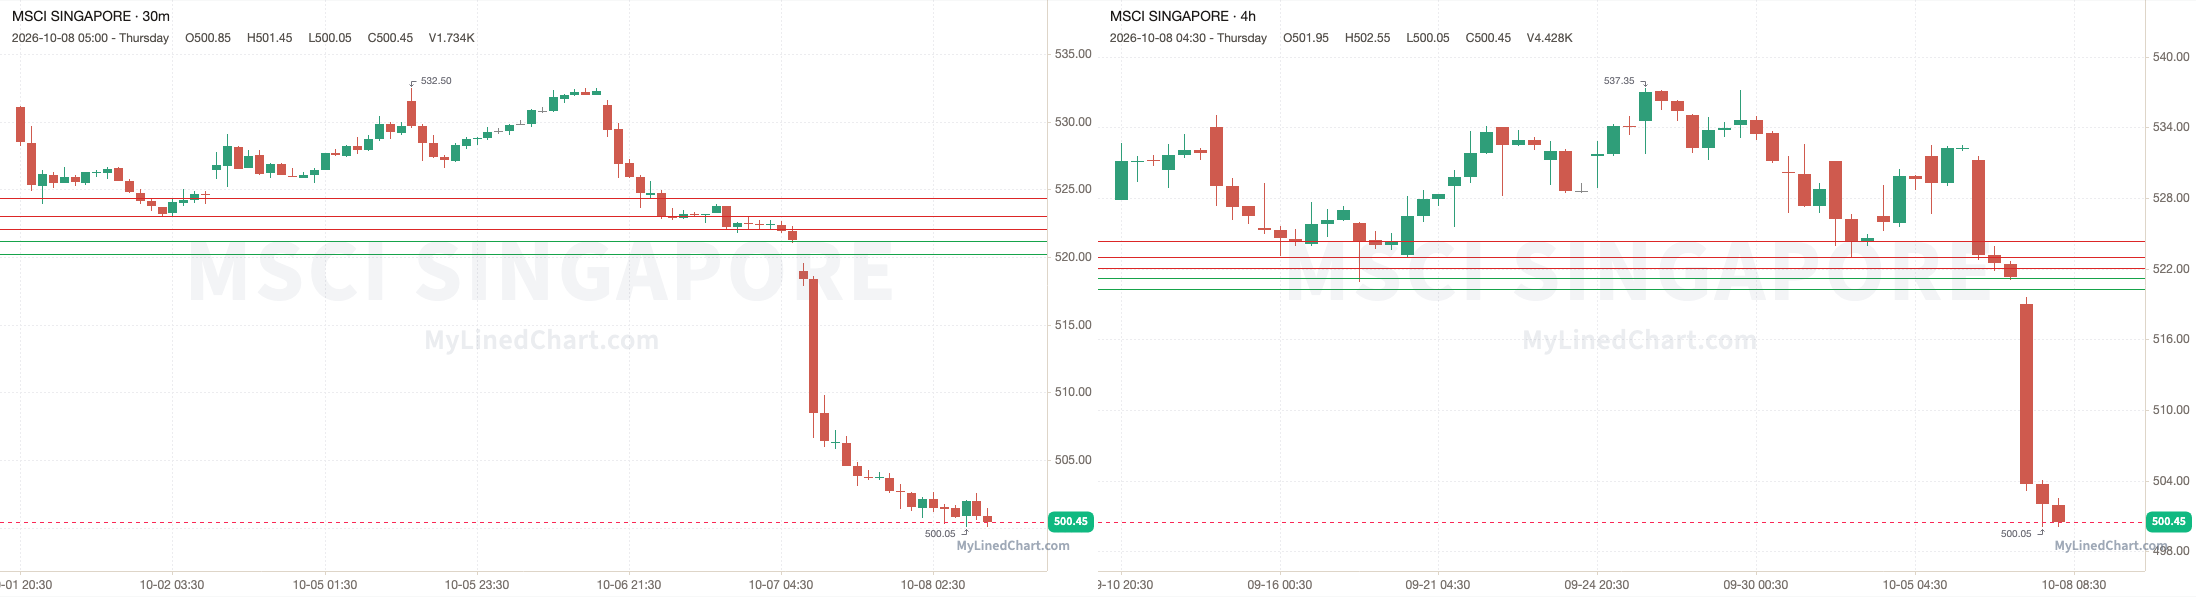
MSCI Singapore opened at 519, under the 521.20 pivot and every level in the plan, and never traded back up to them, with a high of 519.55 and a low of 500.05, then ended up closing at 500.45. Finishing the trading session down 3.57% intraday.
October 8th session levels:
All listed levels: 520.25, 521.20, 522.05, 523, 524.35
Resistance above: 522.05, 523, 524.35
Support below: 521.20, 520.25
Nearest pivot: 521.20
Above 522.05 → 523 next
Lose 521.20 → 520.25 next
See the MSCI Singapore trade plan on Little Bird Trading
India: NIFTY 50
A recap of how the October 8th NIFTY 50 trading session and levels played out
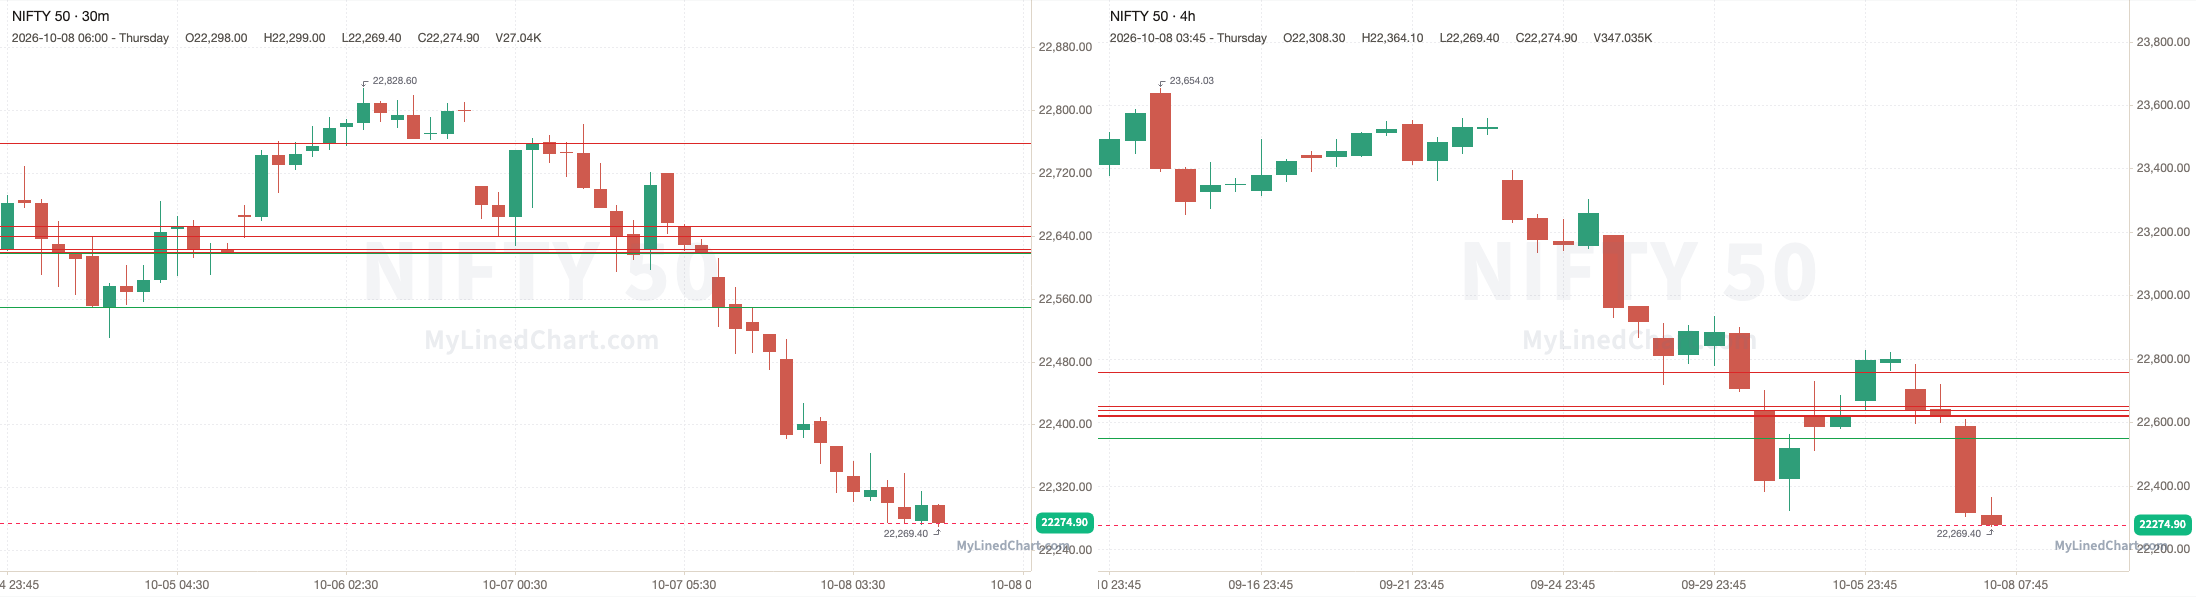
NIFTY opened at 22588.20, stayed under the 22618.10 pivot and ran through every support level down to 22550.10, and kept going to a low of 22269.40, then ended up closing at 22274.90. Finishing the trading session down 1.39% intraday and down 1.52% overall.
October 8th session levels:
All listed levels: 22550.10, 22618.10, 22620.10, 22623.90, 22640, 22652.60, 22758.40
Resistance above: 22620.10, 22623.90, 22640, 22652.60, 22758.40
Support below: 22618.10, 22550.10
Nearest pivot: 22618.10
Above 22620.10 → 22623.90 next
Lose 22618.10 → 22550.10 next
See the NIFTY 50 trade plan on Little Bird Trading
Australia: SPI
A recap of how the October 8th SPI trading session and levels played out
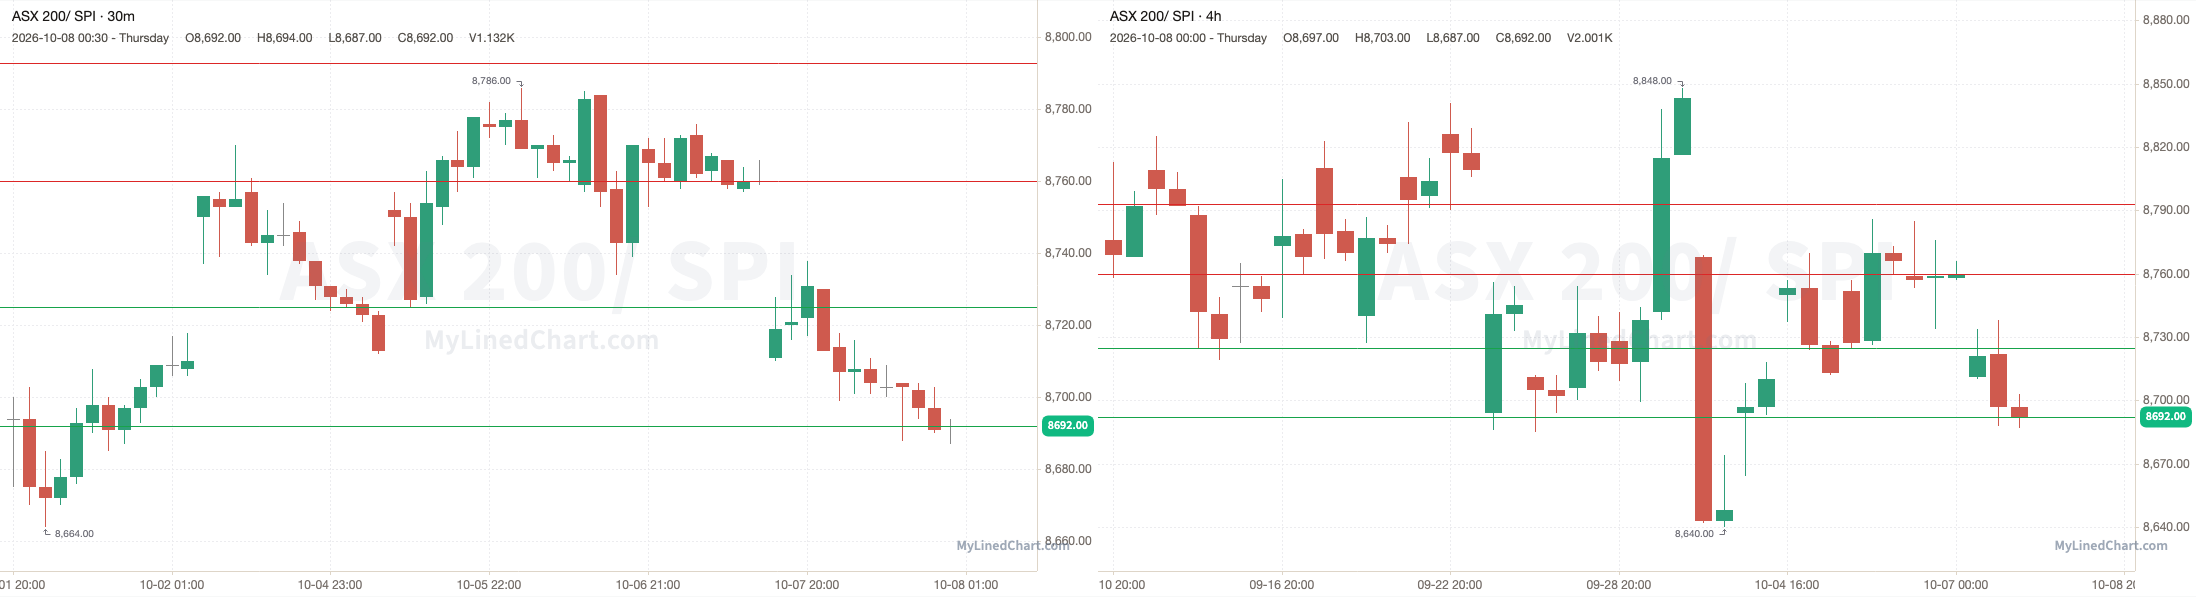
SPI opened at 8711, stayed under the 8760 pivot and dropped to tag 8692, with a low of 8687, then ended up closing at 8692. Finishing the trading session down 0.22% intraday and down 0.78% overall.
October 8th session levels:
All listed levels: 8692, 8725, 8760, 8793
Resistance above: 8760, 8793
Support below: 8725, 8692
Nearest pivot: 8760
Above 8760 → 8793 next
Lose 8725 → 8692 next
See the SPI trade plan on Little Bird Trading
Europe
Germany: DAX 40
A recap of how the October 8th DAX 40 trading session and levels played out
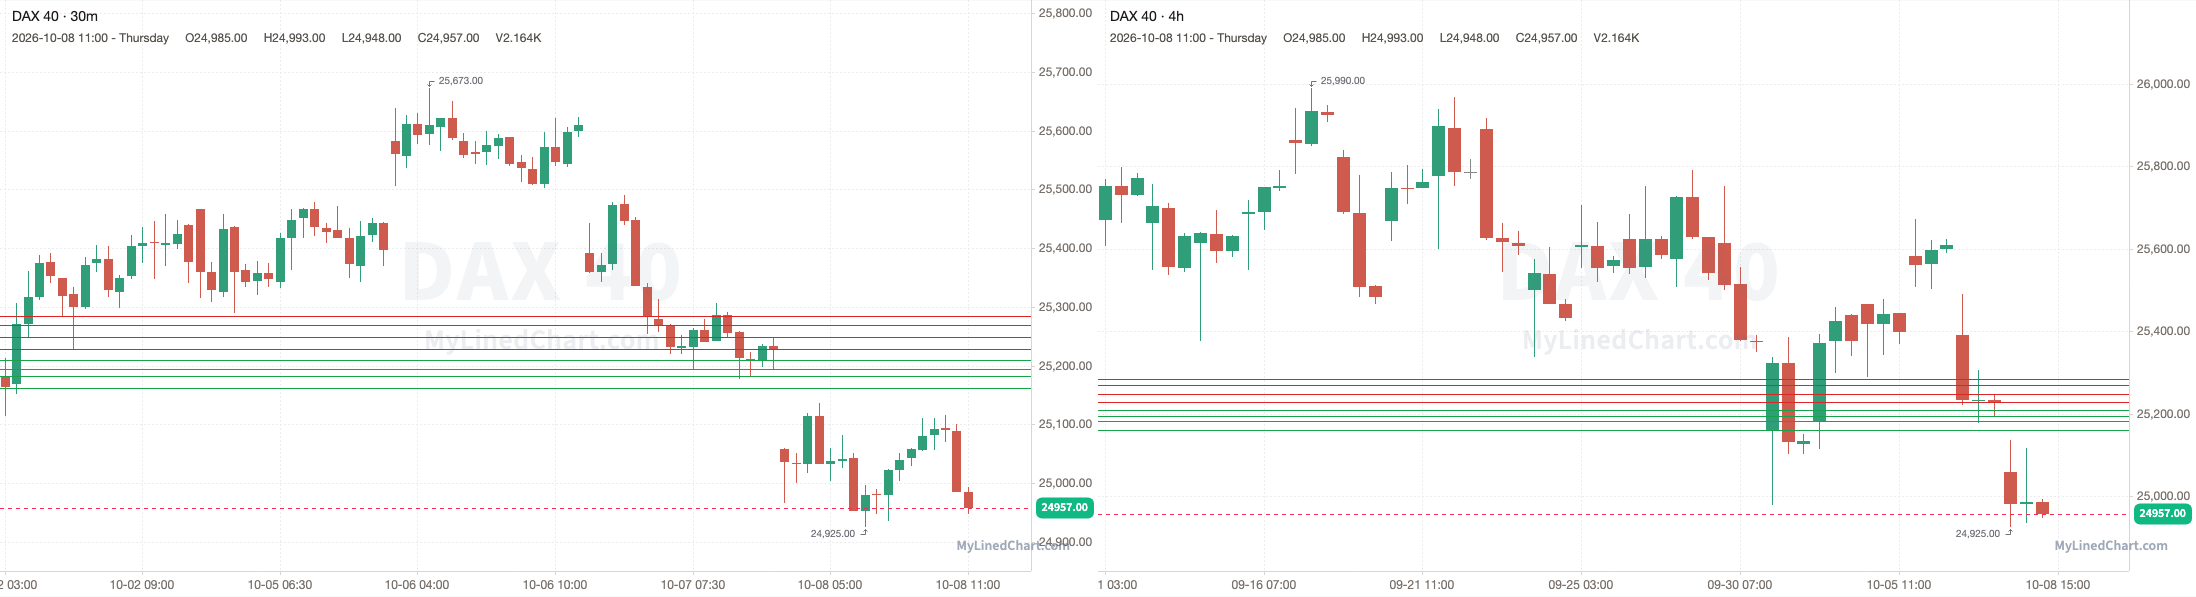
DAX 40 opened at 25058, under the 25228 pivot and every level in the plan, and never traded back up to them, with a high of 25137 and a low of 24925, then ended up closing at 24957. Finishing the trading session down 0.40% intraday.
October 8th session levels:
All listed levels: 25161, 25182, 25194, 25209, 25228, 25248, 25269, 25284
Resistance above: 25248, 25269, 25284
Support below: 25209, 25194, 25182, 25161
Nearest pivot: 25228
Above 25248 → 25269 next
Lose 25209 → 25194 next
See the DAX 40 trade plan on Little Bird Trading
Eurozone: Euro Stoxx 50
A recap of how the October 8th Euro Stoxx 50 trading session and levels played out
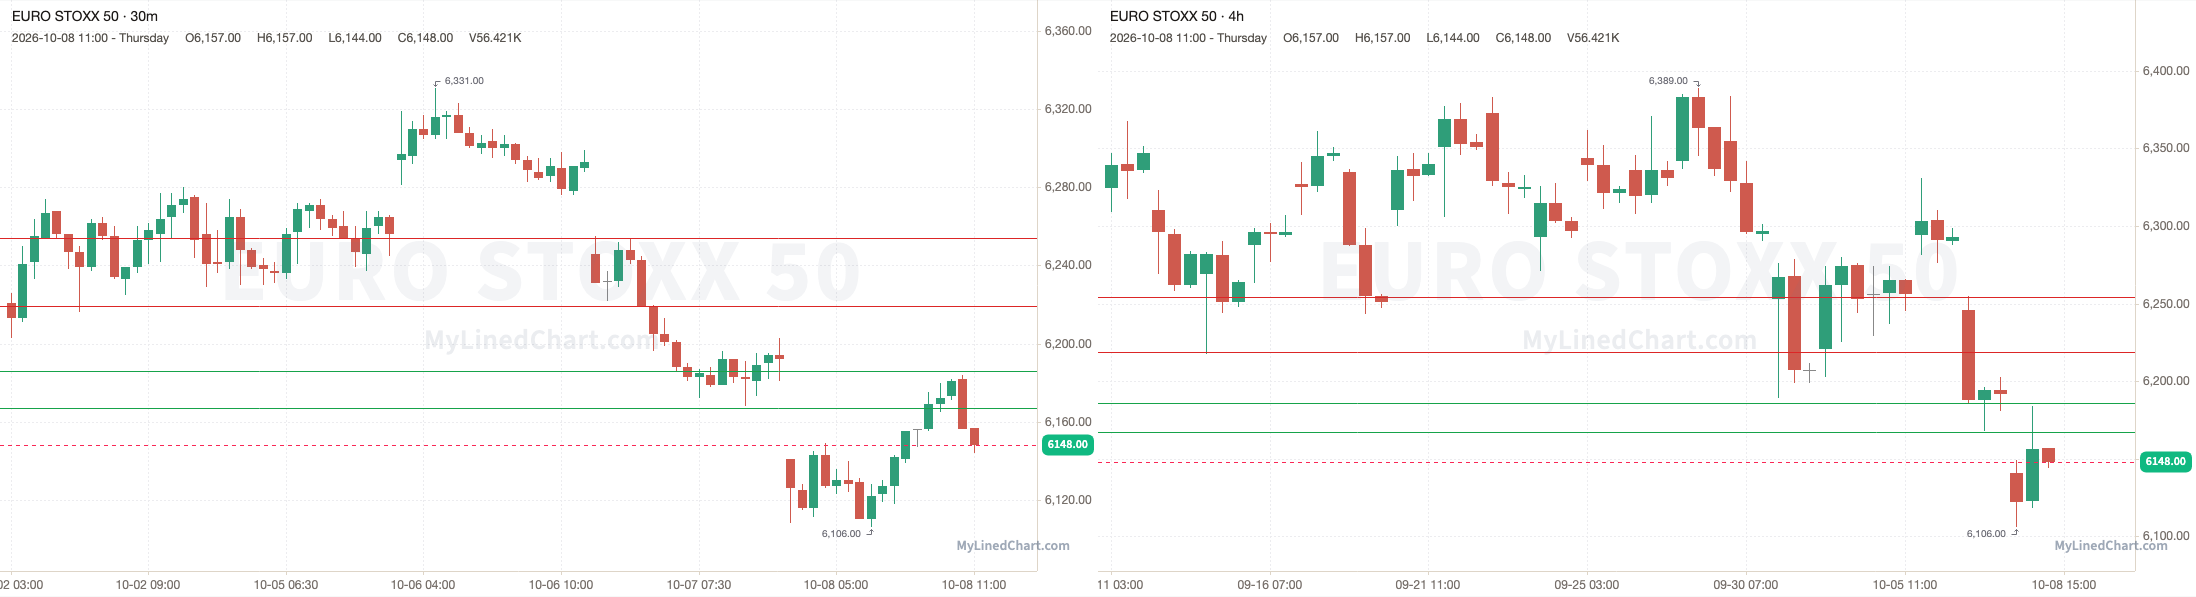
Euro Stoxx 50 opened at 6141, stayed under the 6186 pivot and pushed to a high of 6184, then ended up closing at 6148. Finishing the trading session up 0.11% intraday.
October 8th session levels:
All listed levels: 6167, 6186, 6219, 6254
Resistance above: 6219, 6254
Support below: 6186, 6167
Nearest pivot: 6186
Above 6219 → 6254 next
Lose 6186 → 6167 next
See the Euro Stoxx 50 trade plan on Little Bird Trading
UK: FTSE 100
A recap of how the October 8th FTSE 100 trading session and levels played out
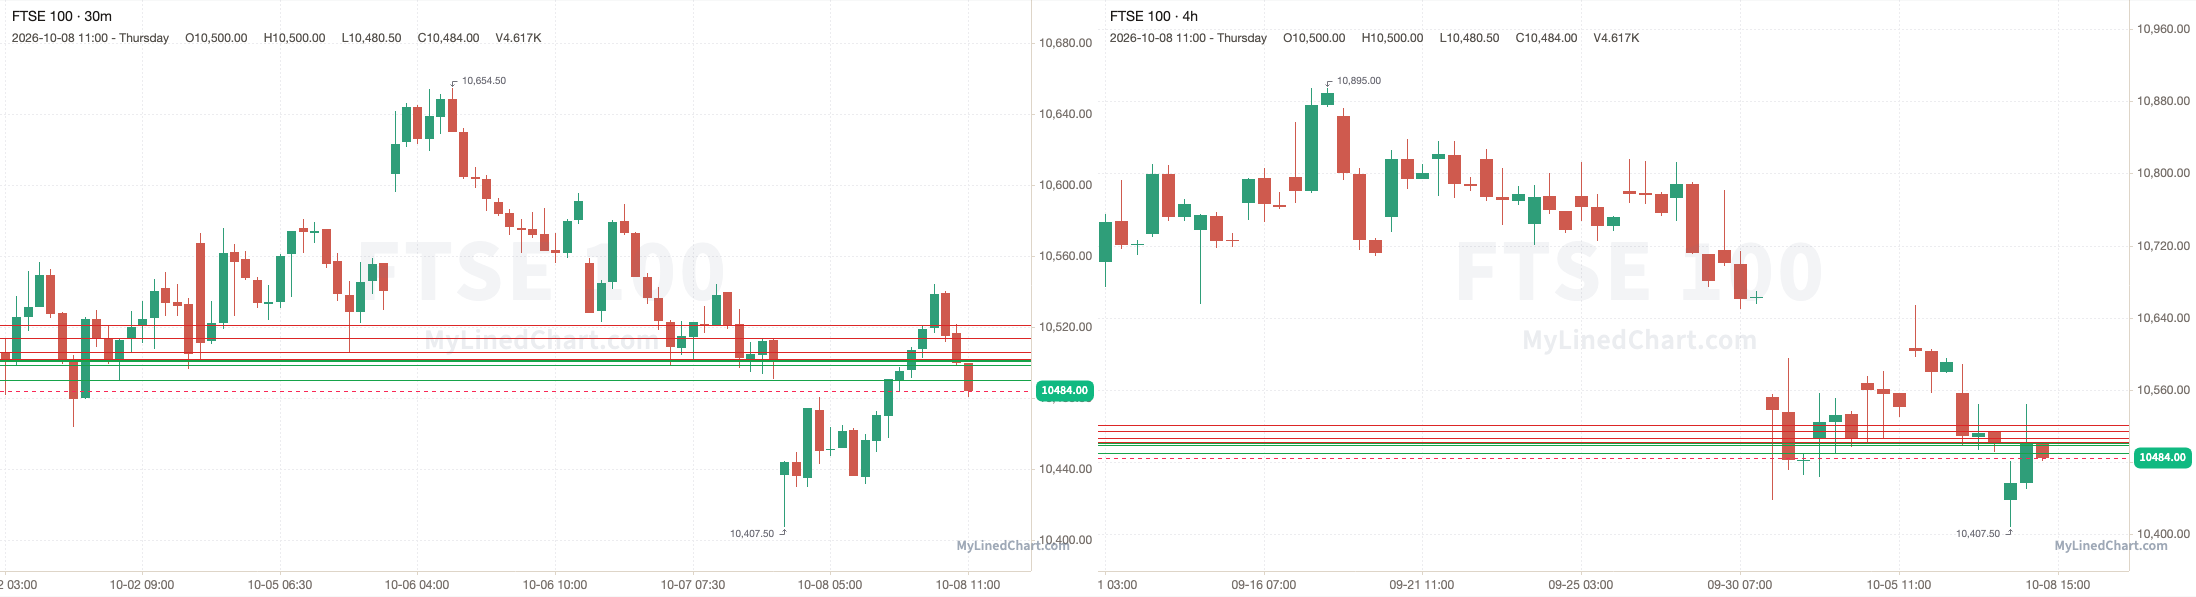
FTSE 100 opened at 10437, broke above the 10502 pivot and ran through every resistance level up to 10521, and kept going to a high of 10544, then ended up closing at 10484. Finishing the trading session up 0.45% intraday.
October 8th session levels:
All listed levels: 10490, 10498.50, 10501, 10501.50, 10501.75, 10501.95, 10502, 10502.26, 10506, 10514, 10521
Resistance above: 10502.26, 10506, 10514, 10521
Support below: 10501.95, 10501.75, 10501.50, 10501, 10498.50, 10490
Nearest pivot: 10502
Above 10502.26 → 10506 next
Lose 10501.95 → 10501.75 next
See the FTSE 100 trade plan on Little Bird Trading
France: CAC 40
A recap of how the October 8th CAC 40 trading session and levels played out
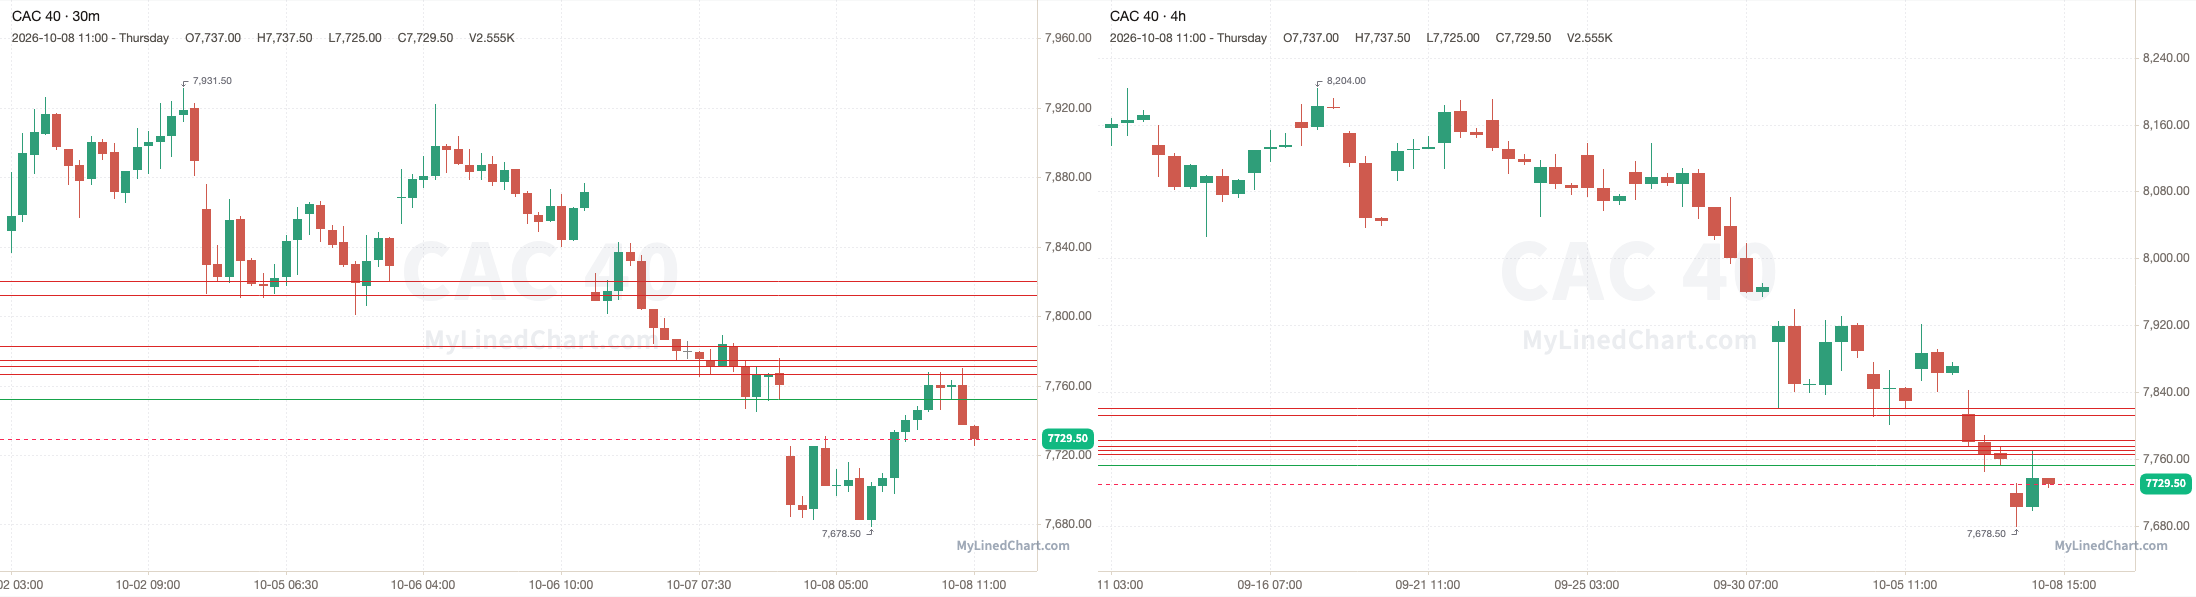
CAC 40 opened at 7719.50, broke above the 7766.50 pivot and pushed to a high of 7770, then ended up closing at 7729.50. Finishing the trading session up 0.13% intraday.
October 8th session levels:
All listed levels: 7752.50, 7766.50, 7771, 7775, 7783, 7812, 7820.50
Resistance above: 7766.50, 7771, 7775, 7783, 7812, 7820.50
Support below: 7752.50
Nearest pivot: 7766.50
Above 7766.50 → 7771 next
Lose 7752.50 → open air
See the CAC 40 trade plan on Little Bird Trading
Spain: IBEX 35
A recap of how the October 8th IBEX 35 trading session and levels played out
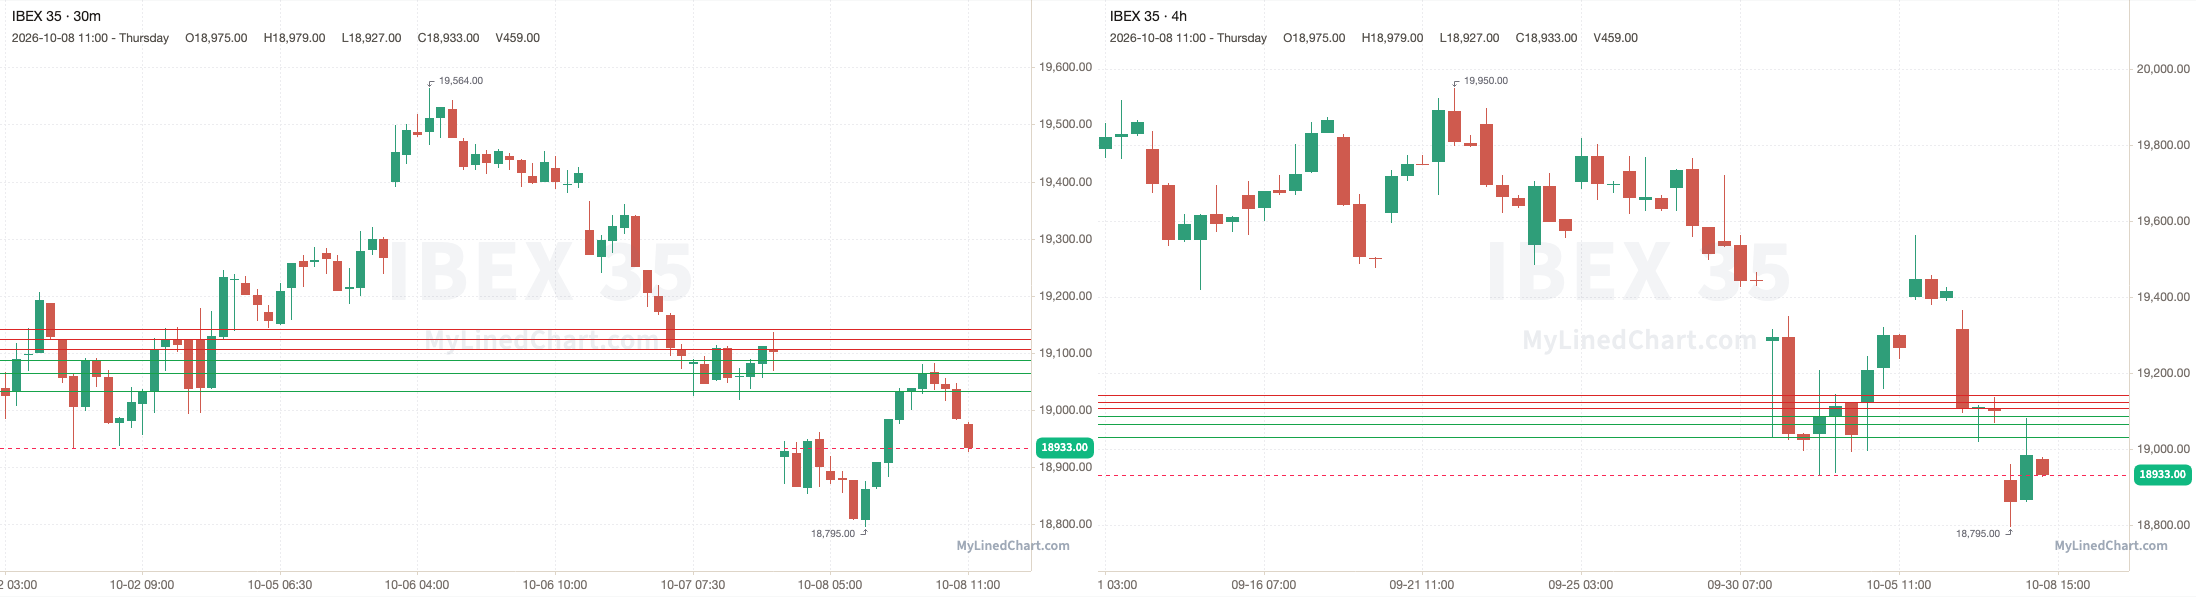
IBEX 35 opened at 18918, stayed under the 19107 pivot and pushed to a high of 19083, then ended up closing at 18933. Finishing the trading session up 0.08% intraday.
October 8th session levels:
All listed levels: 19033, 19065, 19088, 19107, 19124, 19142
Resistance above: 19107, 19124, 19142
Support below: 19088, 19065, 19033
Nearest pivot: 19107
Above 19107 → 19124 next
Lose 19088 → 19065 next
See the IBEX 35 trade plan on Little Bird Trading
Italy: FTSE MIB
A recap of how the October 8th FTSE MIB trading session and levels played out
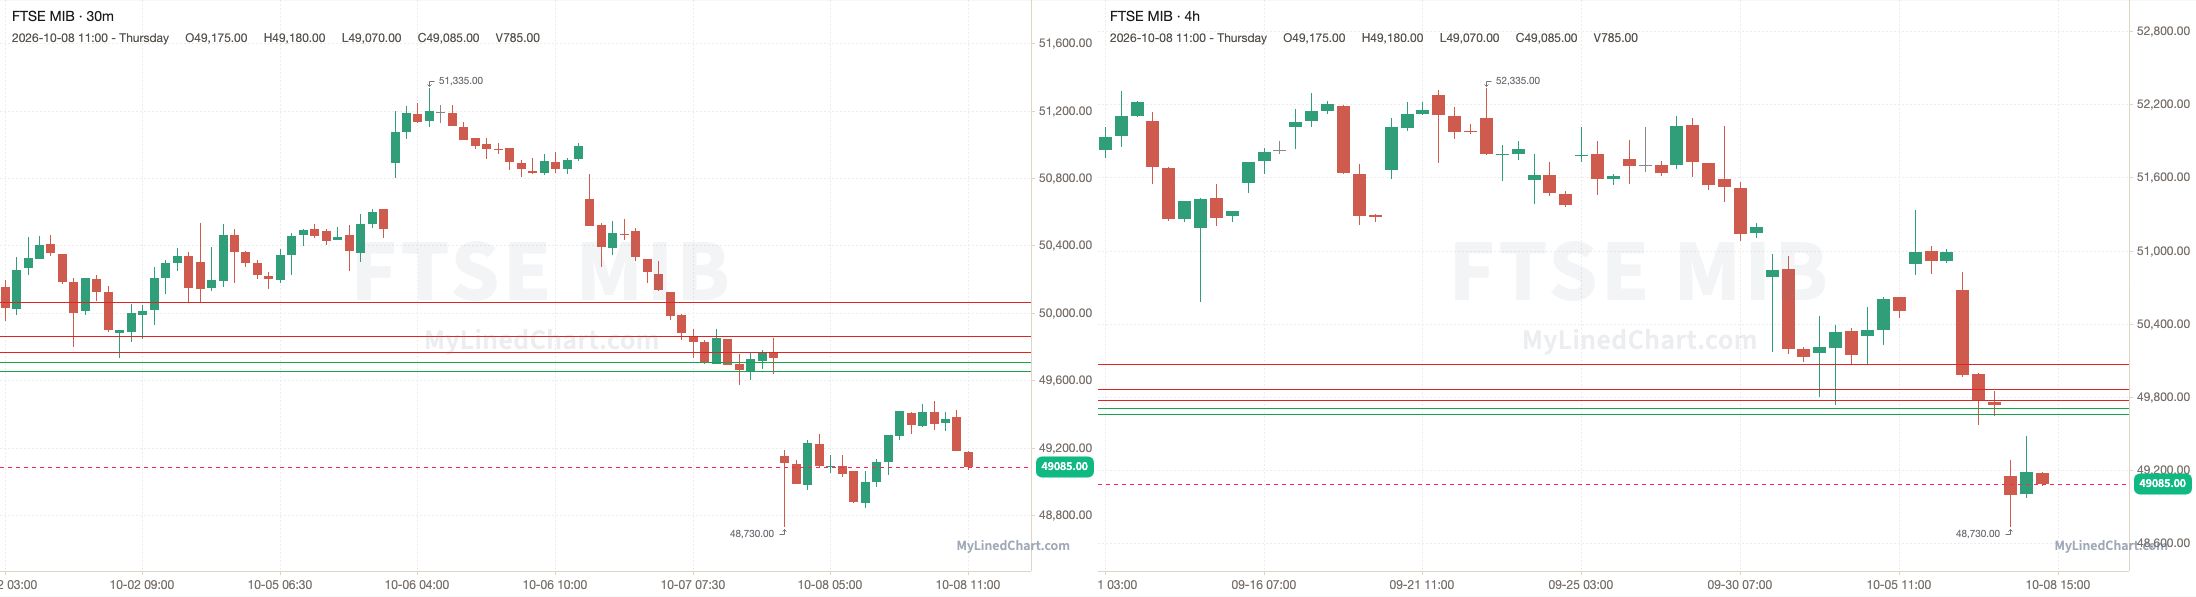
FTSE MIB opened at 49150, under the 49710 pivot and every level in the plan, and never traded back up to them, with a high of 49480 and a low of 48730, then ended up closing at 49085. Finishing the trading session down 0.13% intraday.
October 8th session levels:
All listed levels: 49655, 49710, 49770, 49865, 50065
Resistance above: 49770, 49865, 50065
Support below: 49710, 49655
Nearest pivot: 49710
Above 49770 → 49865 next
Lose 49710 → 49655 next
See the FTSE MIB trade plan on Little Bird Trading
Netherlands: AEX
A recap of how the October 8th AEX trading session and levels played out
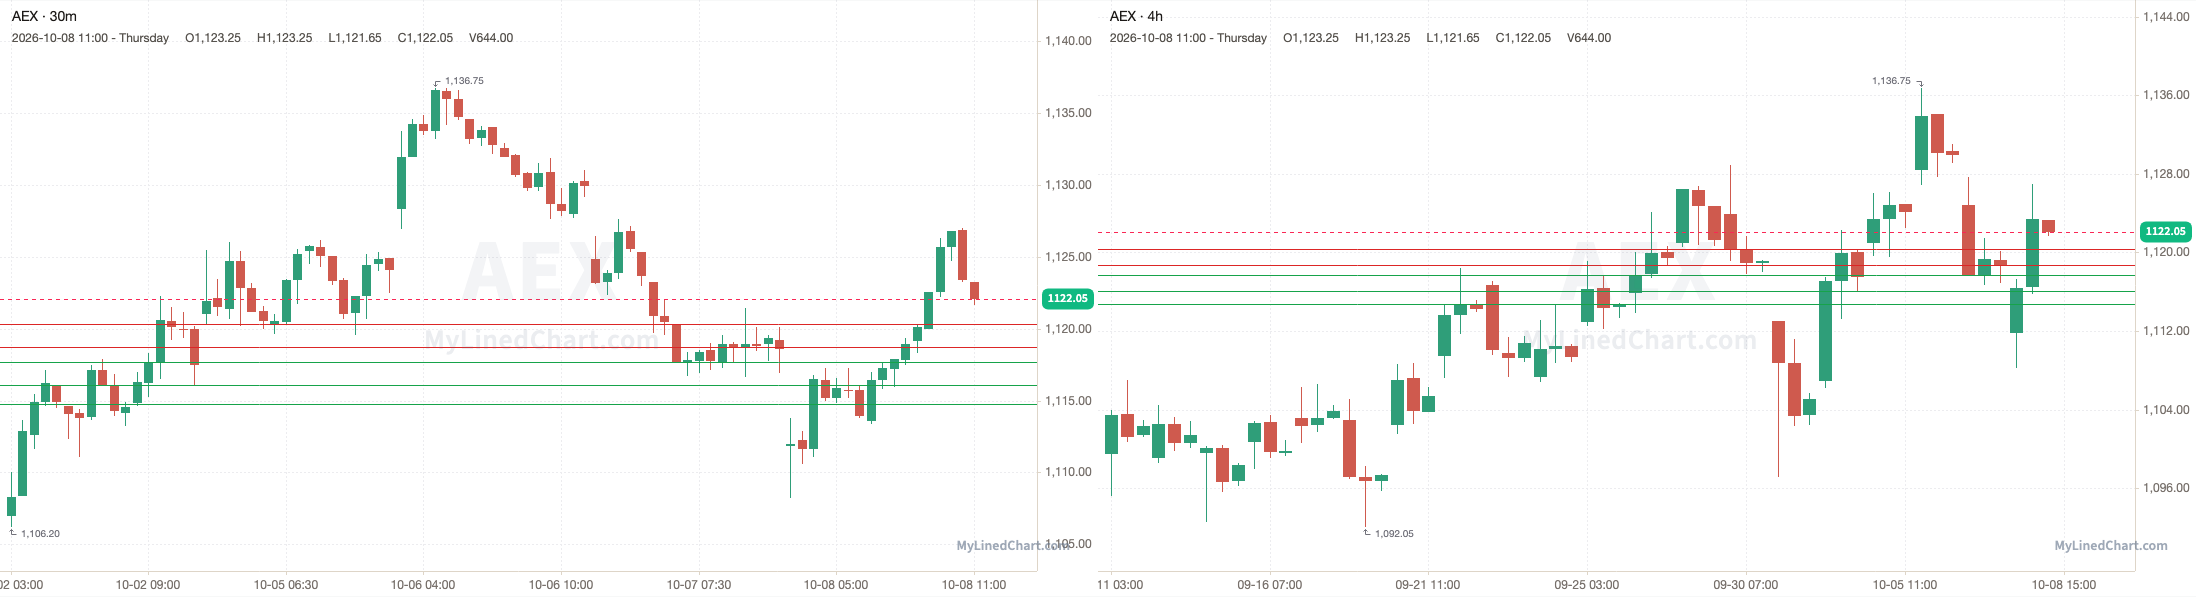
AEX opened at 1111.85, broke above the 1118.70 pivot and ran through every resistance level up to 1120.35, and kept going to a high of 1127, then ended up closing at 1122.05. Finishing the trading session up 0.92% intraday.
October 8th session levels:
All listed levels: 1114.75, 1116.10, 1117.70, 1118.70, 1120.35
Resistance above: 1118.70, 1120.35
Support below: 1117.70, 1116.10, 1114.75
Nearest pivot: 1118.70
Above 1118.70 → 1120.35 next
Lose 1117.70 → 1116.10 next
See the AEX trade plan on Little Bird Trading
Sweden: OMXS30
A recap of how the October 8th OMXS30 trading session and levels played out
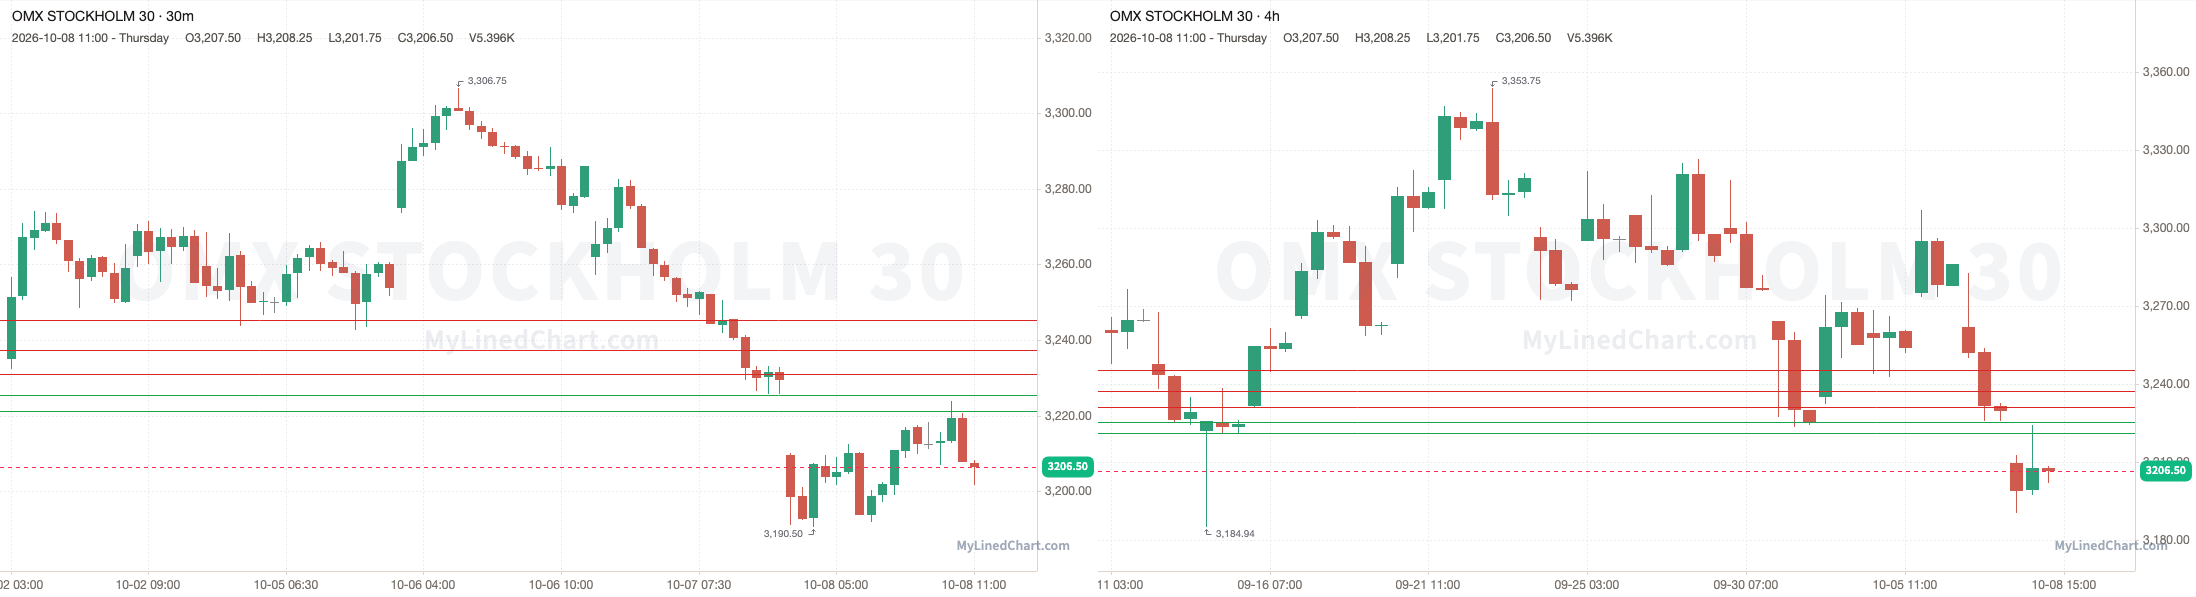
OMXS30 opened at 3209.50, stayed under the 3231 pivot and dropped to a low of 3190.50, then ended up closing at 3206.50. Finishing the trading session down 0.09% intraday.
October 8th session levels:
All listed levels: 3221.25, 3225.50, 3231, 3237.25, 3245.25
Resistance above: 3231, 3237.25, 3245.25
Support below: 3225.50, 3221.25
Nearest pivot: 3231
Above 3231 → 3237.25 next
Lose 3225.50 → 3221.25 next
See the OMXS30 trade plan on Little Bird Trading
Switzerland: SMI
A recap of how the October 8th SMI trading session and levels played out
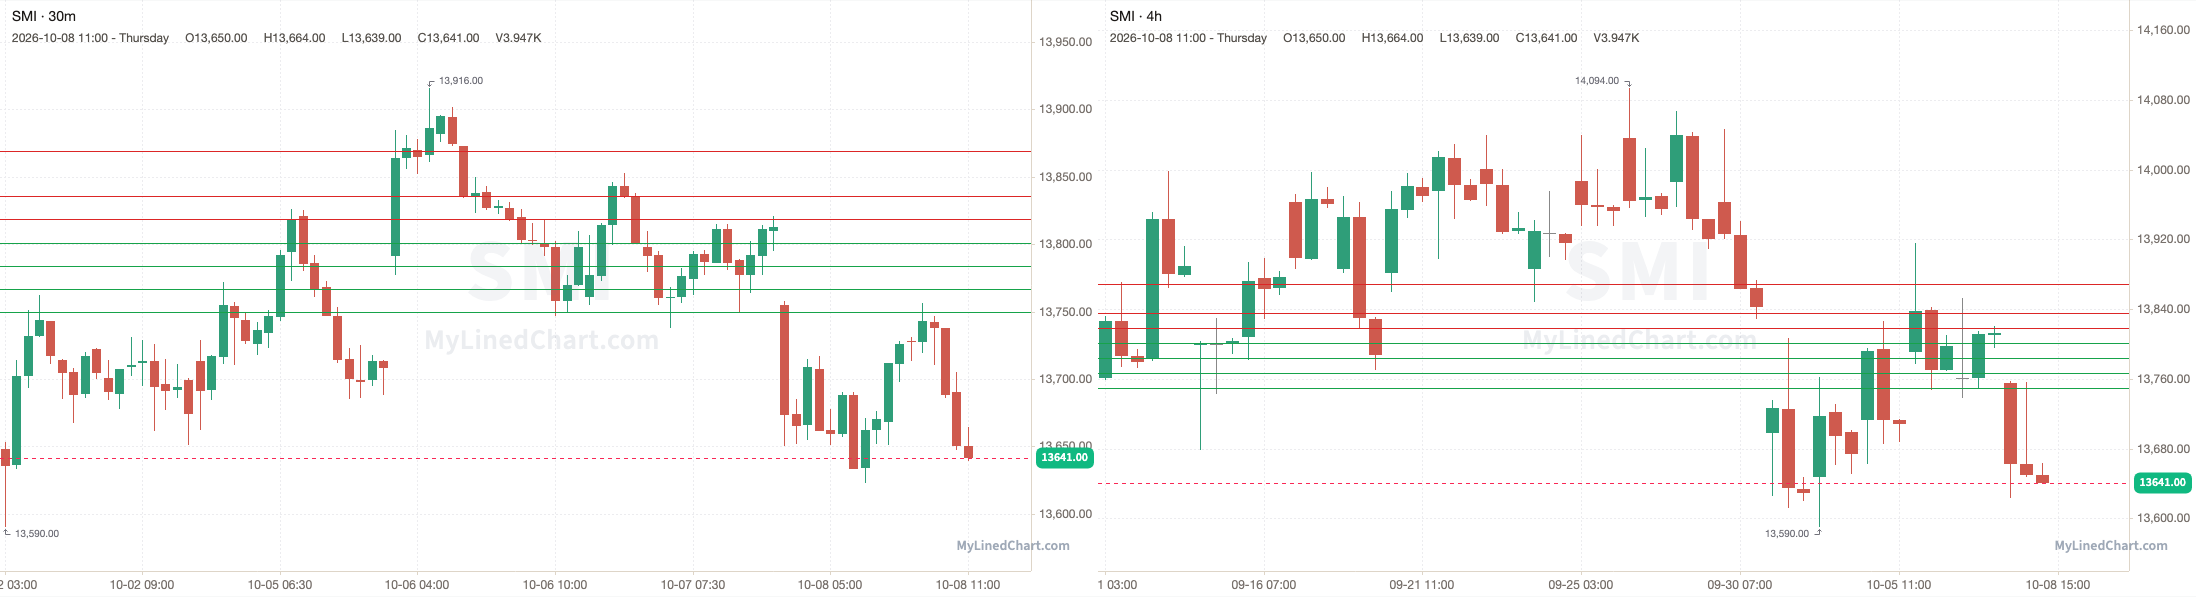
SMI opened at 13755, stayed under the 13819 pivot and dropped to tag 13750, with a low of 13623, then ended up closing at 13641. Finishing the trading session down 0.83% intraday.
October 8th session levels:
All listed levels: 13750, 13767, 13784, 13801, 13819, 13836, 13869
Resistance above: 13819, 13836, 13869
Support below: 13801, 13784, 13767, 13750
Nearest pivot: 13819
Above 13819 → 13836 next
Lose 13801 → 13784 next
See the SMI trade plan on Little Bird Trading
Latin America
Mexico: S&P/BMV IPC
A recap of how the October 8th S&P/BMV IPC trading session and levels played out
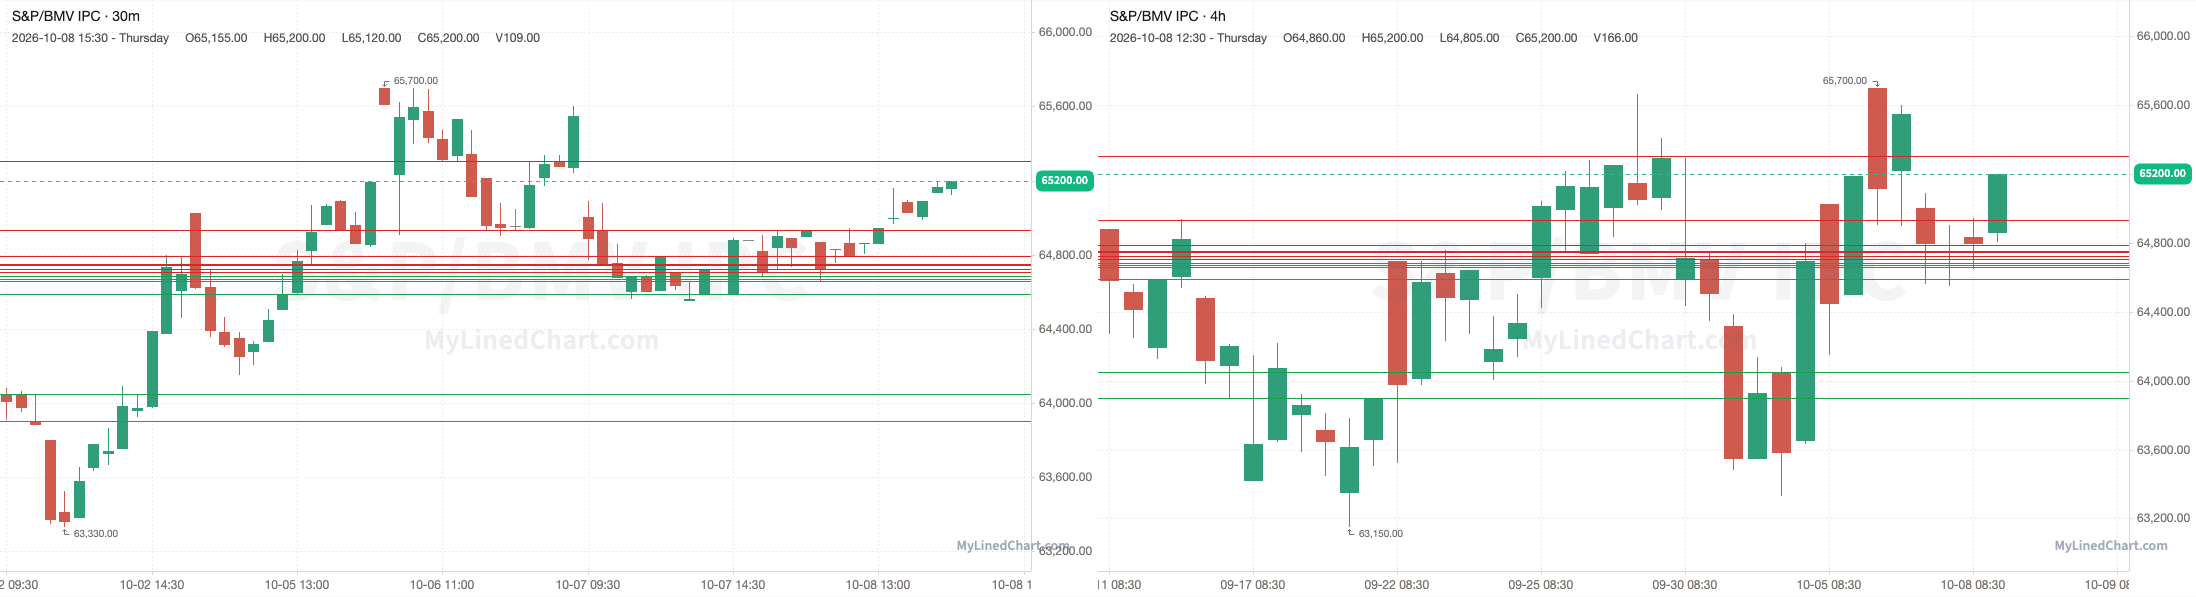
S&P/BMV IPC opened at 64835, dipped below the 64707 pivot to a low of 64650, then reclaimed it and ran up to tag 64935, with a high of 65200, then ended up closing at 65200. Finishing the trading session up 0.56% intraday.
October 8th session levels:
All listed levels: 63900, 64050, 64590, 64659, 64669, 64685, 64707, 64723, 64745, 64750, 64790, 64935, 65305
Resistance above: 64707, 64723, 64745, 64750, 64790, 64935, 65305
Support below: 64685, 64669, 64659, 64590, 64050, 63900
Nearest pivot: 64707
Above 64707 → 64723 next
Lose 64685 → 64669 next
See the S&P/BMV IPC trade plan on Little Bird Trading
Brazil: Ibovespa
No Ibovespa review available today.
See the Ibovespa trade plan on Little Bird Trading
Get each market's levels in real time as they're posted. Sign up on Little Bird Trading.
Pro: next-session levels for the markets you trade, on Little Bird Trading.
Disclaimer: Little Bird Trading and any of its associations may or may not, whether long or short, have a position in any instruments. Not investment advice. Provided for informational purposes only. Not a recommendation or endorsement. Not registered or licensed. Model portfolios are property of their respective owners. All data is sourced from publicly available information. No guarantee is being made or offered. Not responsible for financial loss or ruin. Little Bird Trading may earn a commission if you purchase through links on the site.
Day Trade Levels for the October 9th Trading Session:
Enjoying this content?
Subscribe on Substack