

How to Use MyLinedChart to Build a DCF Thesis Map
A DCF model belongs in a spreadsheet. The investment thesis does not.
The spreadsheet can calculate intrinsic value, test discount rates, and show what happens when revenue growth or margins change. But the spreadsheet usually does a poor job of showing the investor what to do with that information once price starts moving.
That is where a DCF thesis map helps.
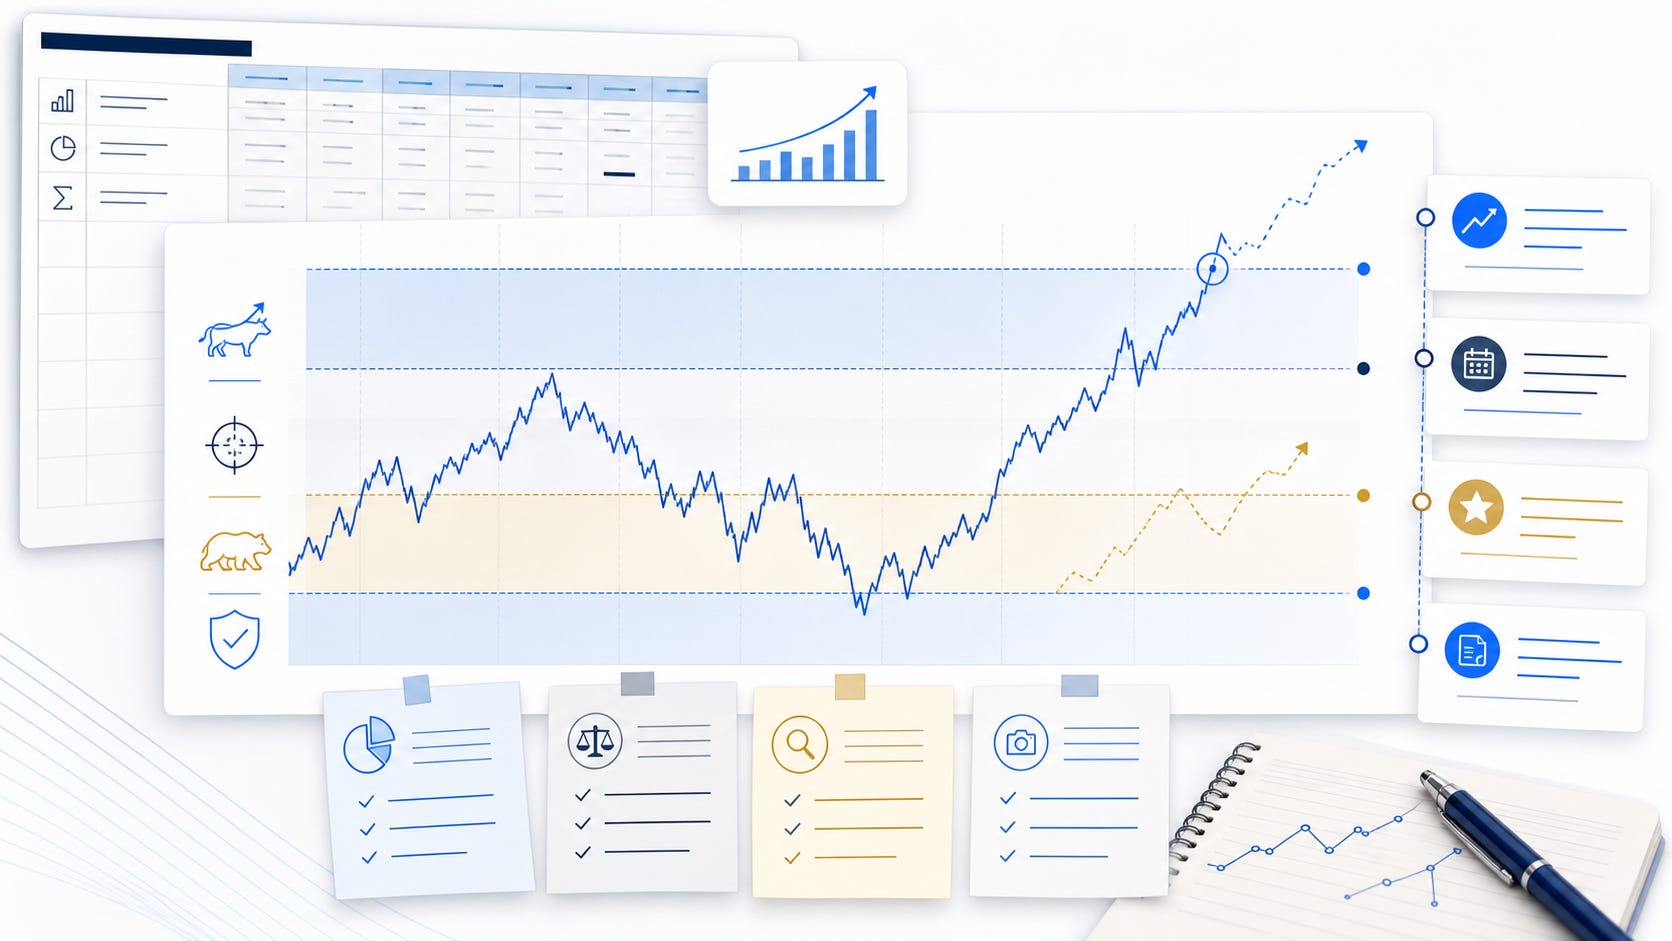
A DCF thesis map is the visual layer around the model. It connects fair value ranges, margin-of-safety levels, catalysts, assumption changes, and review notes directly to the price chart. For a fundamental investor, the point is not to become a short-term technical trader. The point is to keep the valuation case visible when the market gives you new information.
Note: This was originally published on MyLinedChart. Get your first week free.
The Problem With Most DCF Work
A lot of DCF work starts with real effort and ends as a forgotten file.
The investor builds a model, changes the assumptions, arrives at a fair value estimate, maybe writes a short thesis, and then moves on. A few weeks later, price moves. Earnings come out. Guidance changes. Rates shift. Sentiment gets worse or better.
The original model may still exist, but the active decision context is scattered.
Why was the base case fair value set there?
What revenue assumption supported the bull case?
What margin change would break the thesis?
What price was supposed to offer a margin of safety?
What event was supposed to trigger a review?
If those answers are not easy to see, the investor is more likely to let price movement rewrite the thesis after the fact.
What a DCF Thesis Map Should Show
A useful thesis map does not replace the financial model. It makes the model easier to use.
The spreadsheet should still handle cash flows, margin forecasts, discount rates, terminal value, share count, and sensitivity tables. The visual map should handle the decision layer around those numbers.
Bear Case
Map the lower fair value zone. Ask: what has to go wrong for this to be the right value?
Base Case
Map the main intrinsic value range. Ask: what assumptions have to hold?
Bull Case
Map the upside value zone. Ask: what evidence would justify this higher value?
Margin of Safety
Map the preferred buy zone. Ask: where does price compensate for being wrong?
Catalyst
Add an event note or review marker. Ask: what should force a model update?
Assumption Change
Add a chart note tied to date and price. Ask: did the thesis improve, weaken, or stay the same?
How MyLinedChart Fits Into the Workflow
MyLinedChart is useful here because it gives the investor a place to organize price, notes, levels, and review context together.
The model can stay in Excel, Google Sheets, or whatever tool you use for valuation. MyLinedChart becomes the operating layer around the model.
Use the spreadsheet to calculate fair value.
Use MyLinedChart to draw bear, base, and bull value zones.
Use the spreadsheet to update revenue, margin, and discount-rate assumptions.
Use MyLinedChart to note why those assumptions changed.
Use the spreadsheet to test sensitivities.
Use MyLinedChart to see whether price is offering value, confirming risk, or forcing a review.
That separation matters. The spreadsheet answers, “What is this worth under these assumptions?” The thesis map answers, “What am I supposed to do when price, earnings, or evidence changes?”
A Simple DCF Thesis Map Process
The workflow can stay simple.
1. Start with the fair value range
Do not map a single precise target as if the model is perfect. Map a range. At minimum, use bear, base, and bull case values. If you have a margin-of-safety price, mark that separately.
2. Attach the key assumptions
Each value zone should have a reason. The base case might depend on a certain revenue growth rate. The bull case might depend on margin expansion. The bear case might reflect slower growth, lower multiples, or a higher discount rate.
The goal is to make the assumptions visible before conviction starts drifting.
3. Mark the catalyst or review date
Every thesis needs a review trigger. That might be earnings, guidance, a filing, a product update, a debt maturity, a rate change, or a specific operating metric.
If nothing would make you review the model, the thesis is probably too vague.
4. Track what changed
When price moves, do not only ask whether the stock is up or down. Ask whether the evidence changed.
Did revenue expectations change?
Did margins improve or compress?
Did management guidance confirm the thesis?
Did the discount-rate environment change?
Did the market create a better margin of safety?
Those notes become part of the thesis history. That history is what makes future decisions more reviewable.
The Biggest Mistake to Avoid
The biggest mistake is treating the DCF output like a magic number.
A DCF is only as useful as the assumptions behind it. A thesis map forces the investor to keep those assumptions attached to price and evidence. That makes it harder to quietly change the story just because the chart has moved.
The point is not to make investing mechanical. The point is to make the thinking easier to review.
Final Thought
Fundamental investors do not need charts because price action is always right. They need charts because price is where the thesis eventually has to meet reality.
A DCF thesis map helps connect the model, the market, and the decision process. The spreadsheet holds the valuation. MyLinedChart holds the visible operating context around it.
That is a cleaner way to review a position, update a thesis, and avoid letting market noise rewrite the original investment case.
Note: This was originally published on MyLinedChart. Get your first week free.
Enjoying this content?
Subscribe on Substack