

July 7 Lean Report: Key Levels, Tailwinds, and Headwinds
Check the Futures Report (ES NQ) for index-level risk, the Stock Market Report (SPY QQQ + 100 tickers) for setups and S&P Sectors for the broader read. Lean Lines show where to press, reassess or wait
MyLinedChart IBKR users: tell your preferred AI agent, “Fetch Little Bird Trading’s levels and draw them on my charts.”
Reply with one ticker and the timeframe you want to learn more about. I’ll use the most requested to shape future articles, examples, and market breakdowns.
Free subscribers get the S&P Sectors report with MyLinedChart levels and the associated Excel file.
Upgrade to paid now for access to ES, SPY, NQ, QQQ + day-trade levels, YM, RTY, and 100+ tickers with MyLinedChart levels and Excel files for review, backtesting, automation, and decision support.
Today’s day trade levels are below the paywall - previous day trade levels from July 3rd:
ES levels: 7525.97, 7521.29, 7515.62, 7532.75, 7511.75, 7536.40, 7541.75, 7496.61
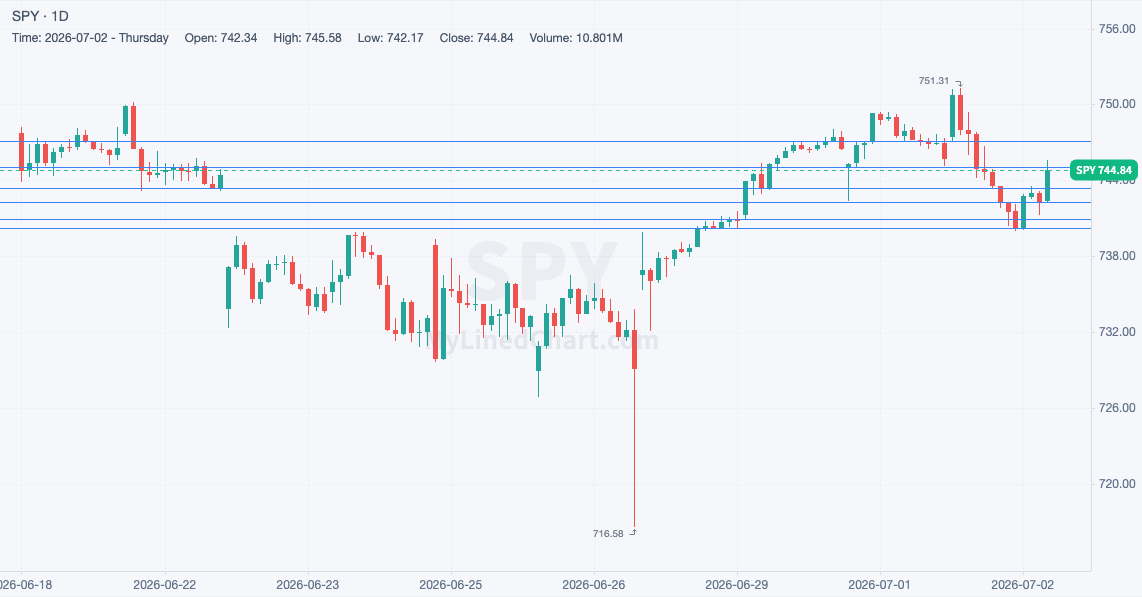
SPY levels: 745.03, 743.36, 747.10, 742.26, 740.91, 740.20
NQ levels: Perch - wait
QQQ levels: Perch - wait
S&P Sectors market breakdown:
No major sector rotation showed up in the Swing Traders read. The S&P sector map stayed broadly unchanged, so the useful takeaway is confirmation rather than a new shift.
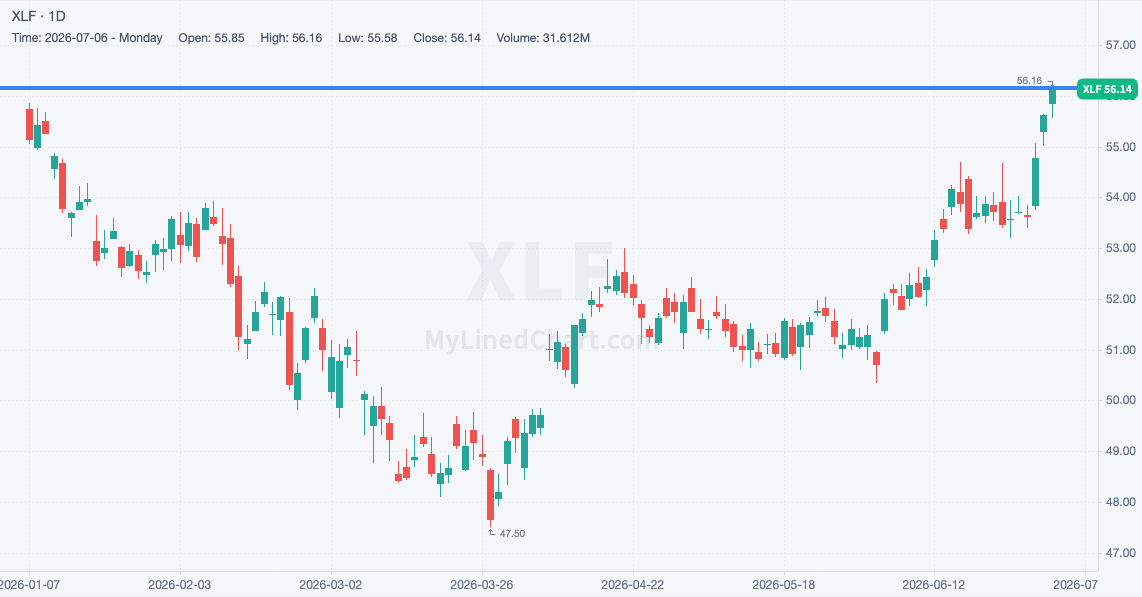
Sector in focus: Financial Services (XLF)
Disclaimer: Little Bird Trading and any of its associations may or may not, whether long or short, have a position in any instruments. Not investment advice. Provided for informational purposes only. Not a recommendation or endorsement. Not registered or licensed. Model portfolios are property of their respective owners. All data is sourced from publicly available information. No guarantee is being made or offered. Not responsible for financial loss or ruin. Little Bird Trading may earn a commission if you purchase through links on the site.
Futures Market & Stock Market Lean Report for Tuesday, July 7th
Enjoying this content?
Subscribe on Substack