

SPY, DAX +18 Global Market Levels: Oct 1st Trade Plan Plus Charts
Support, resistance and pivot levels for SPY, ES, QQQ, NQ and 19 stock markets across Asia, Europe and the Americas ahead of the October 1st session, plus how the last session's levels traded.
MyLinedChart works however you get to a trade: AI-Assisted, Discretionary, Quant, or Macro. Export your lines, levels plus the whole chart as XLSX, JSON, or CSV. Or, let AI do all the work for you.
Here’s an overview of how MyLinedChart compares to Trading View and TrendSpider. Available on Windows, Apple and Android.
Looking for a pro to build your trading workflows? Reach out on Upwork.
Get each market's levels in real time as they're posted. Sign up on Little Bird Trading.
US
A recap of how the September 30th trading session and levels played out
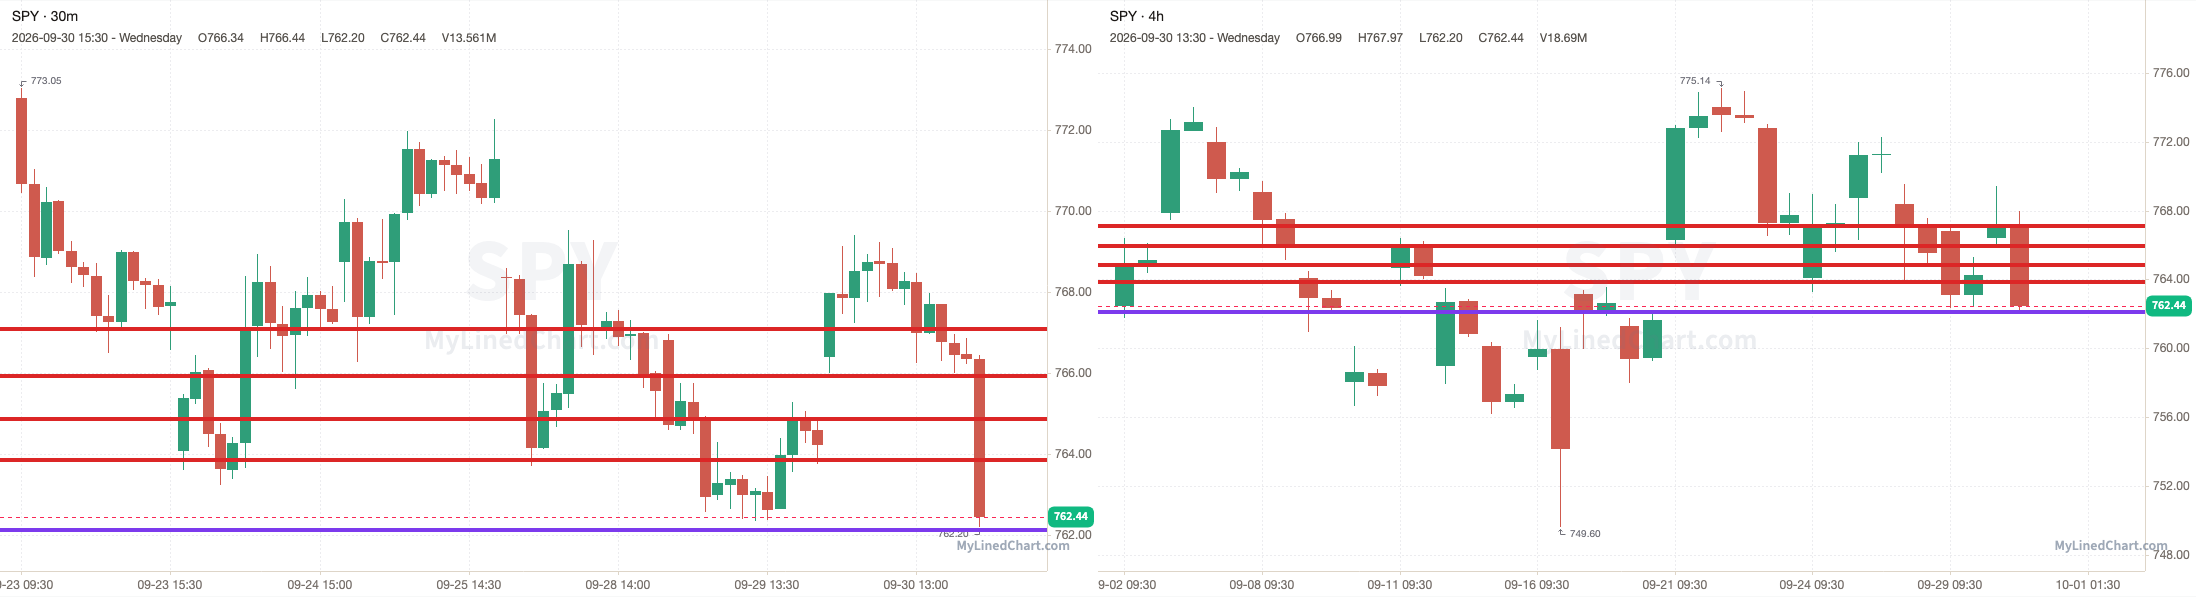
SPY opened at 766.41, chopped inside the 762.13 to 767.10 zone, with a final close of 762.44. SPY finished down 0.52% intraday and down 0.23% overall.
September 30th session levels:
All listed levels: 762.13, 763.85, 764.86, 765.93, 767.10
Resistance above: 764.86, 765.93, 767.10
Support below: 763.85, 762.13
Nearest pivot: 763.85
Above 764.86 → 765.93 next
Lose 763.85 → 762.13 next
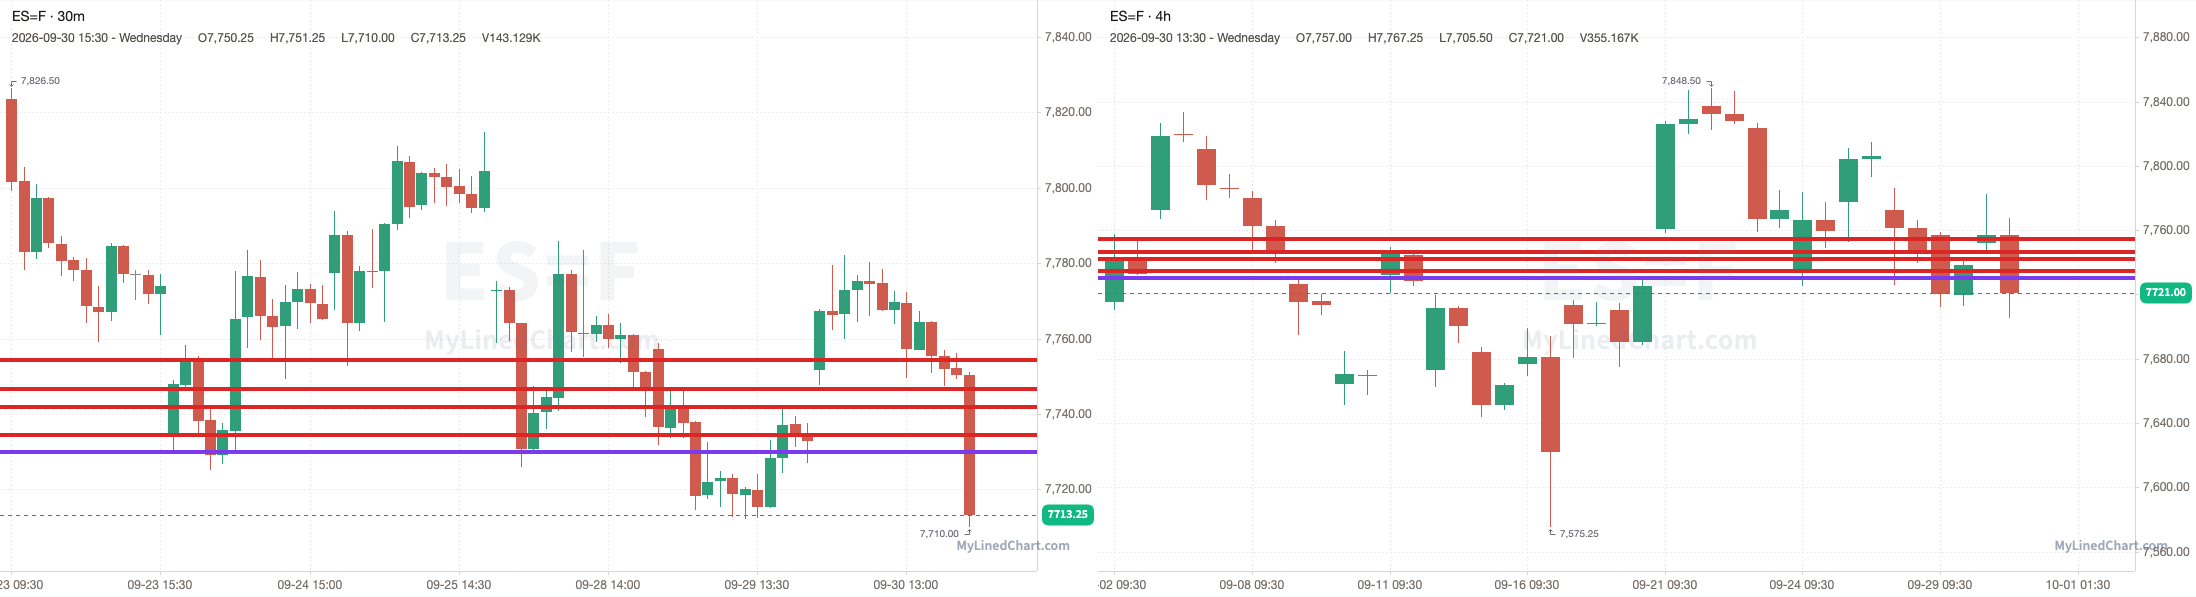
ES opened at 7751.75, started inside the 7730 to 7754.25 zone then lost it, and finally closed at 7721. ES finished down 0.40% intraday and down 0.22% overall.
September 30th session levels:
All listed levels: 7730, 7734.50, 7741.75, 7746.50, 7754.25
Resistance above: 7741.75, 7746.50, 7754.25
Support below: 7734.50, 7730
Nearest pivot: 7741.75
Above 7741.75 → 7746.50 next
Lose 7734.50 → 7730 next
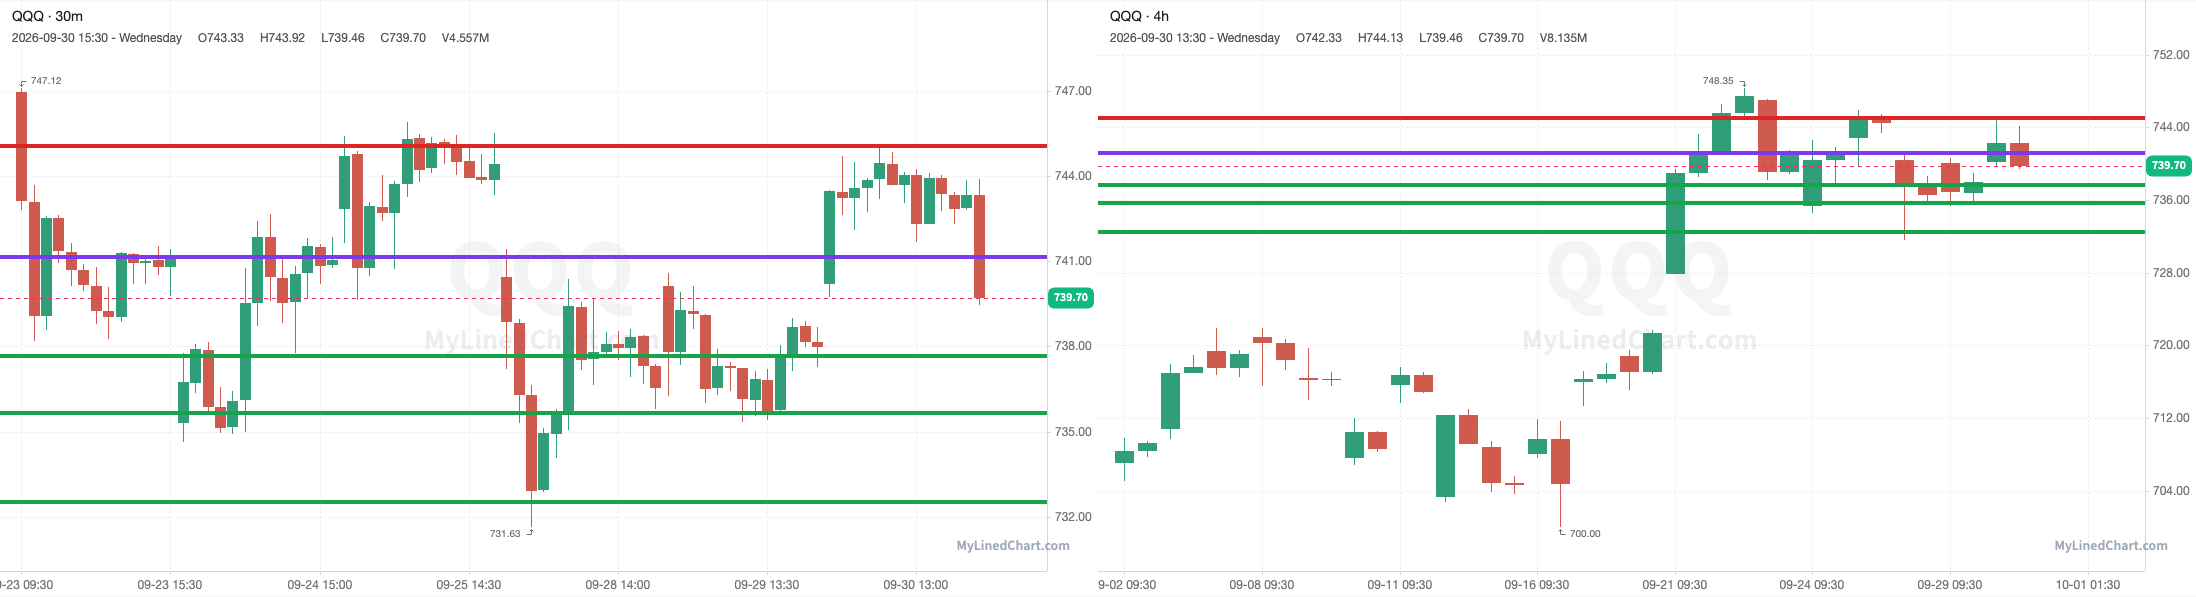
QQQ opened at 740.19, chopped inside the 732.52 to 745.08 zone, with a final close of 739.70. QQQ finished down 0.07% intraday and up 0.23% overall.
September 30th session levels:
All listed levels: 732.52, 735.66, 737.66, 741.17, 745.08
Resistance above: 741.17, 745.08
Support below: 737.66, 735.66, 732.52
Nearest pivot: 737.66
Above 741.17 → 745.08 next
Lose 737.66 → 735.66 next
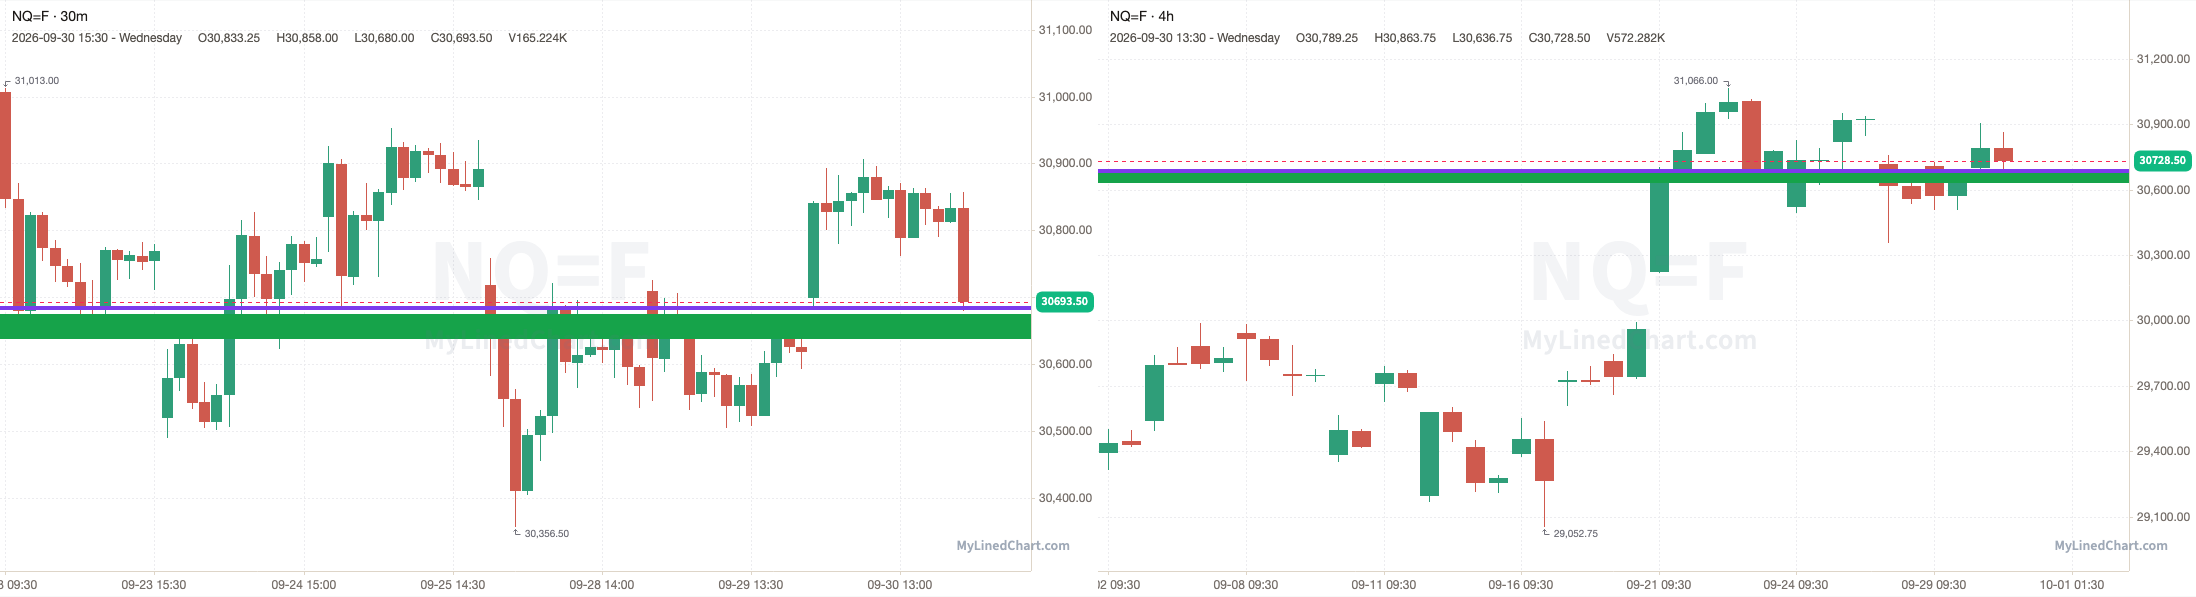
NQ opened at 30699.25, dipped into the 30640 to 30683.50 zone and low of 30636.75, then reclaimed, and finally closed at 30728.50. NQ finished up 0.10% intraday and up 0.25% overall.
September 30th session levels:
All listed levels: 30640, 30646.75, 30651, 30657.25, 30662.50, 30666.50, 30671.25, 30683.50
Resistance above: 30657.25, 30662.50, 30666.50, 30671.25, 30683.50
Support below: 30646.75, 30640
Nearest pivot: 30651
Above 30657.25 → 30662.50 next
Lose 30646.75 → 30640 next
See the SPY, ES, QQQ & NQ trade plan on Little Bird Trading
Asia
Japan: Nikkei 225
A recap of how the September 30th Nikkei 225 trading session and levels played out
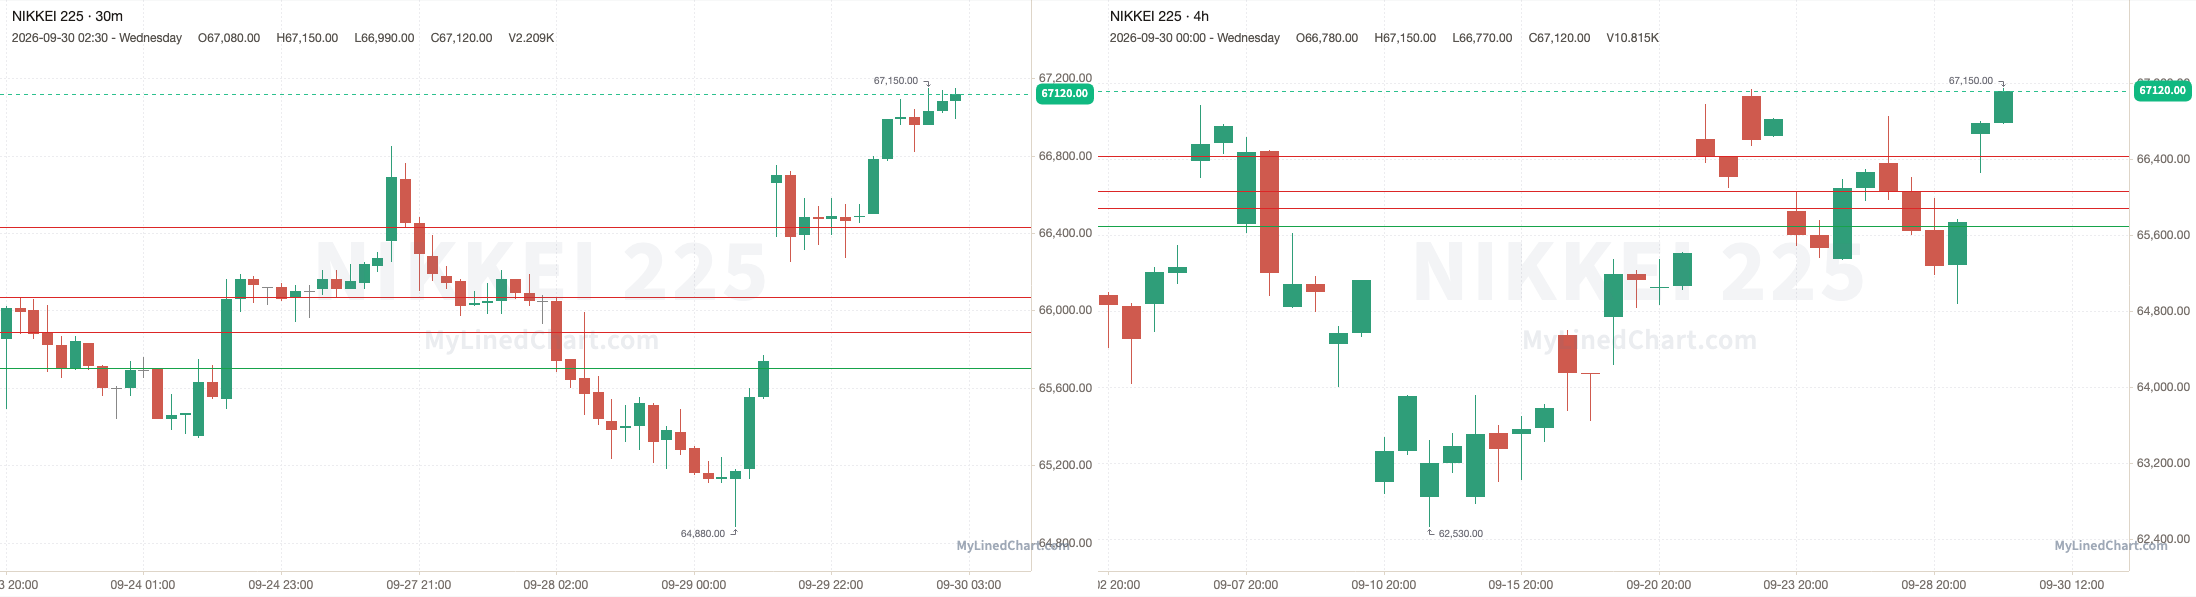
Nikkei 225 opened at 66660, ran up and tagged 66430 and high at 67150, then ended up closing at 67120. Finishing the trading session up 0.69% intraday and up 2.10% overall.
September 30th session levels:
All listed levels: 65700, 65890, 66070, 66430
Resistance above: 65890, 66070, 66430
Support below: 65700
Nearest pivot: 65700
Above 65890 → 66070 next
Lose 65700 → open air
See the Nikkei 225 trade plan on Little Bird Trading
Korea: KOSPI 200
A recap of how the September 30th KOSPI 200 trading session and levels played out
No KOSPI 200 levels set up on September 30th, so there was nothing to review. A patience day: protect capital and wait for the levels to come back.
See the KOSPI 200 trade plan on Little Bird Trading
China: FTSE China A50
A recap of how the September 30th FTSE China A50 trading session and levels played out
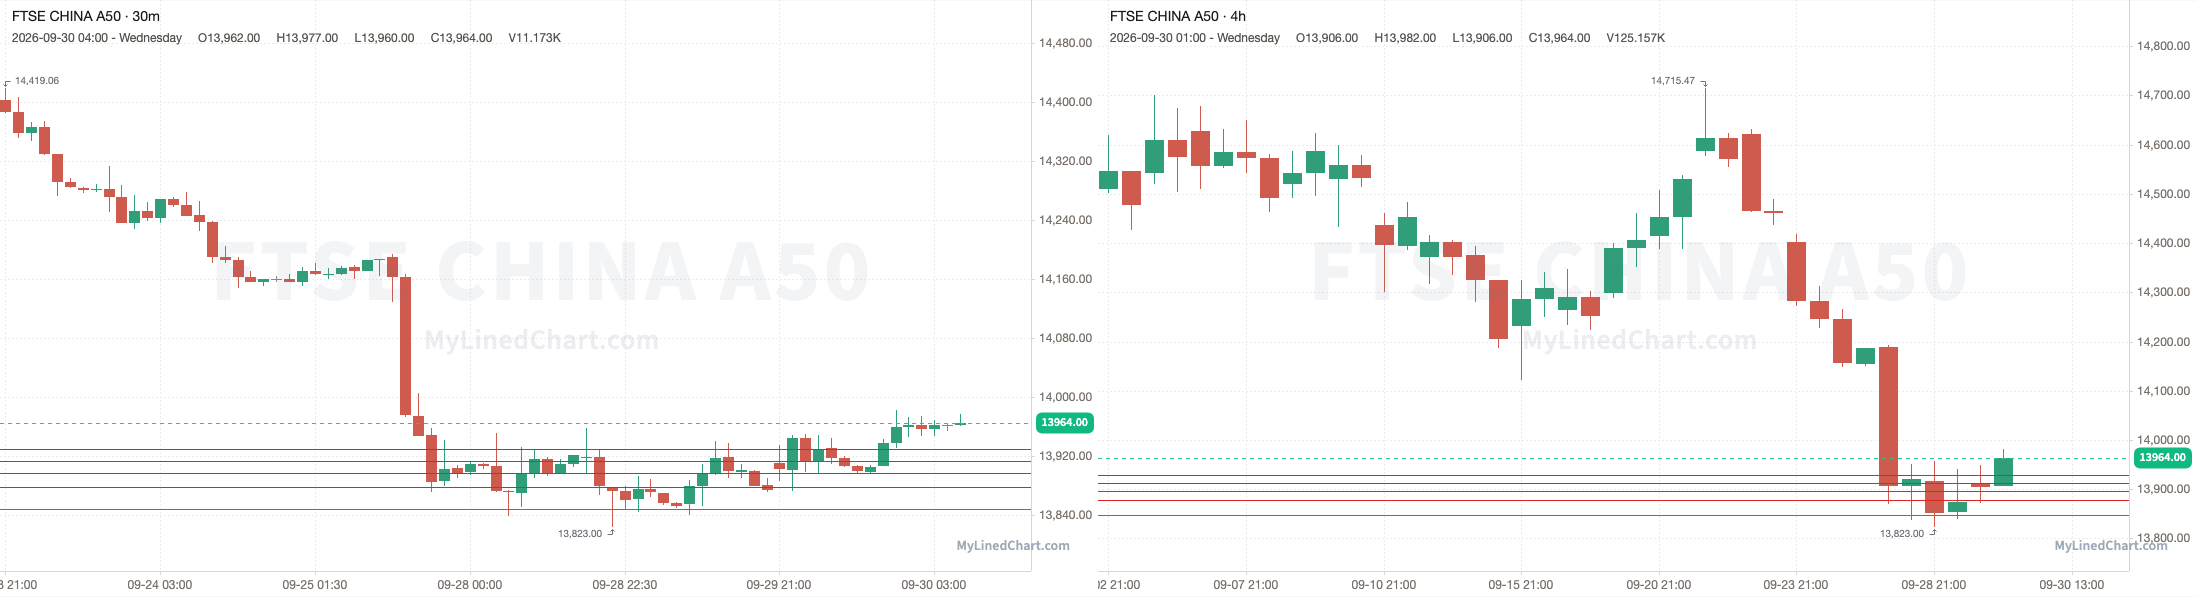
FTSE China A50 opened at 13910, ran up and tagged the 13913 to 13929 zone and high at 13982, then ended up closing at 13964. Finishing the trading session up 0.39% intraday and up 0.66% overall.
September 30th session levels:
All listed levels: 13848, 13878, 13896, 13913, 13929
Resistance above: 13878, 13896, 13913, 13929
Support below: 13848
Nearest pivot: 13878
Above 13878 → 13896 next
Lose 13848 → open air
See the FTSE China A50 trade plan on Little Bird Trading
Hong Kong: Hang Seng
A recap of how the September 30th Hang Seng trading session and levels played out
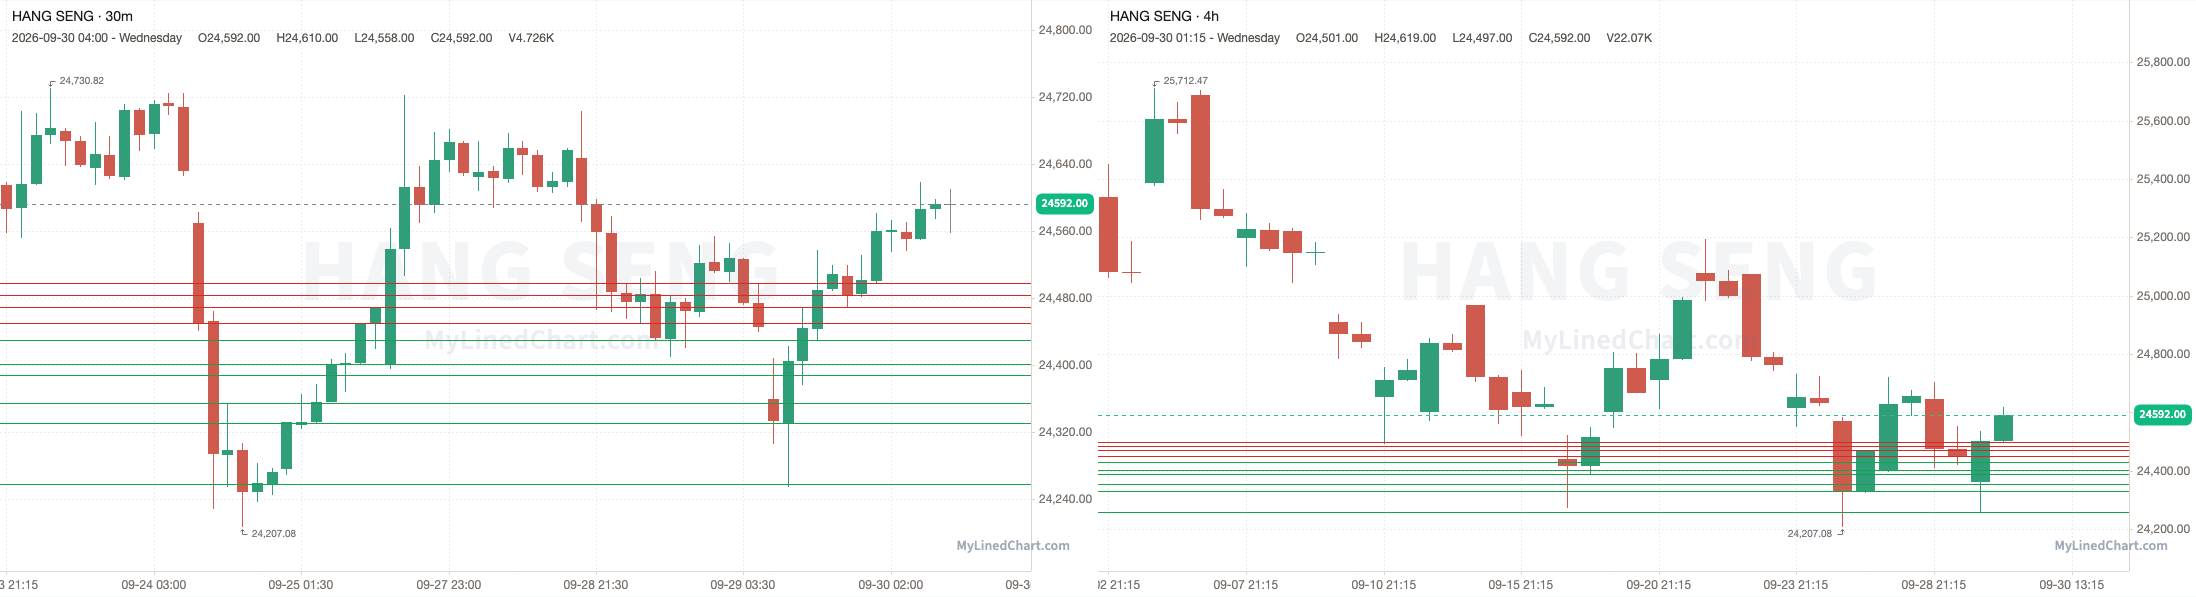
Hang Seng opened at 24360, ran up and tagged the 24484 to 24498 zone and high at 24619, then ended up closing at 24592. Finishing the trading session up 0.95% intraday and up 0.60% overall.
September 30th session levels:
All listed levels: 24258, 24331, 24355, 24389, 24402, 24430, 24451, 24470, 24484, 24498
Resistance above: 24451, 24470, 24484, 24498
Support below: 24430, 24402, 24389, 24355, 24331, 24258
Nearest pivot: 24451
Above 24451 → 24470 next
Lose 24430 → 24402 next
See the Hang Seng trade plan on Little Bird Trading
Taiwan: FTSE Taiwan
A recap of how the September 30th FTSE Taiwan trading session and levels played out
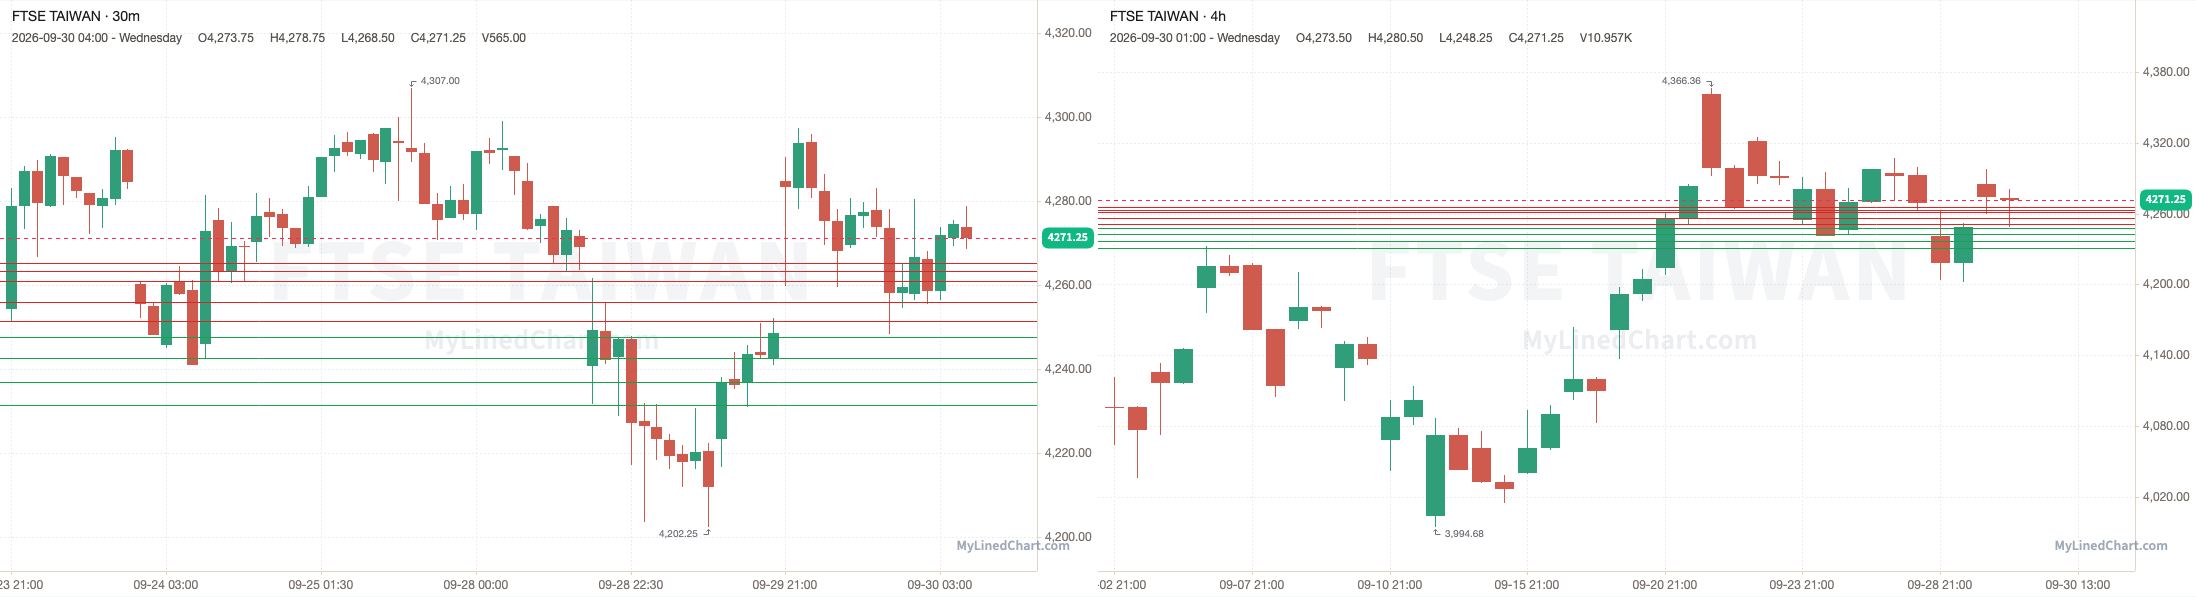
FTSE Taiwan opened at 4284.75, dropped down and tagged the 4251.50 to 4256 zone and low at 4248.25, then ended up closing at 4271.25. Finishing the trading session down 0.32% intraday and up 0.54% overall.
September 30th session levels:
All listed levels: 4231.25, 4236.75, 4242.50, 4247.50, 4251.50, 4256, 4261, 4263.25, 4265.25
Resistance above: 4251.50, 4256, 4261, 4263.25, 4265.25
Support below: 4247.50, 4242.50, 4236.75, 4231.25
Nearest pivot: 4247.50
Above 4251.50 → 4256 next
Lose 4247.50 → 4242.50 next
See the FTSE Taiwan trade plan on Little Bird Trading
Singapore: MSCI Singapore
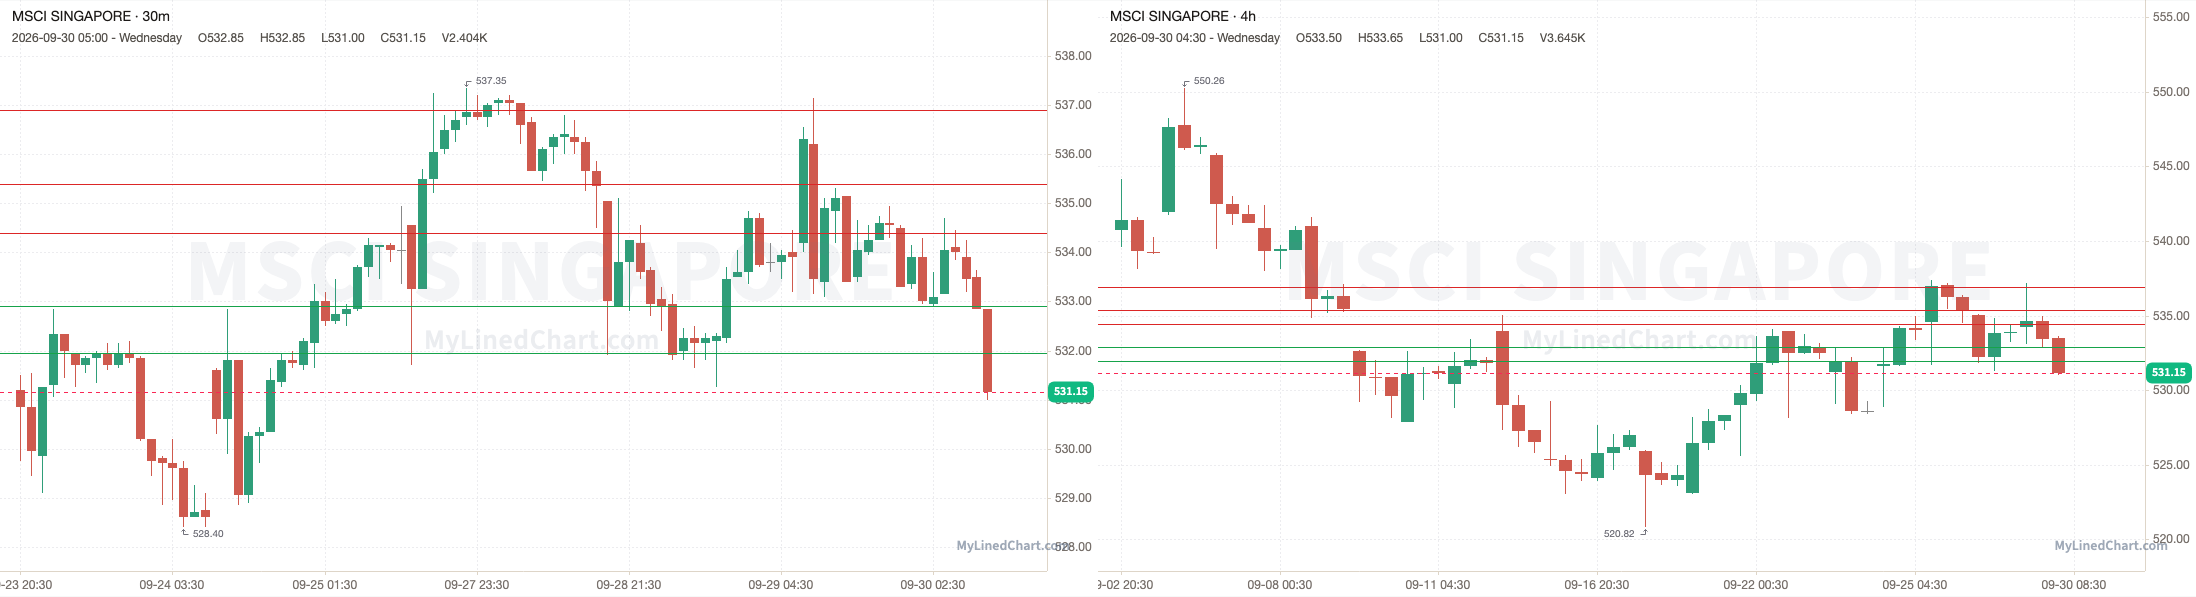
A recap of how the September 30th MSCI Singapore trading session and levels played out
MSCI Singapore opened at 534.20, dropped down and tagged the 531.95 to 532.90 zone and low at 531, then ended up closing at 531.15. Finishing the trading session down 0.57% intraday and down 0.52% overall.
September 30th session levels:
All listed levels: 531.95, 532.90, 534.40, 535.40, 536.90
Resistance above: 534.40, 535.40, 536.90
Support below: 532.90, 531.95
Nearest pivot: 534.40
Above 534.40 → 535.40 next
Lose 532.90 → 531.95 next
See the MSCI Singapore trade plan on Little Bird Trading
India: NIFTY 50
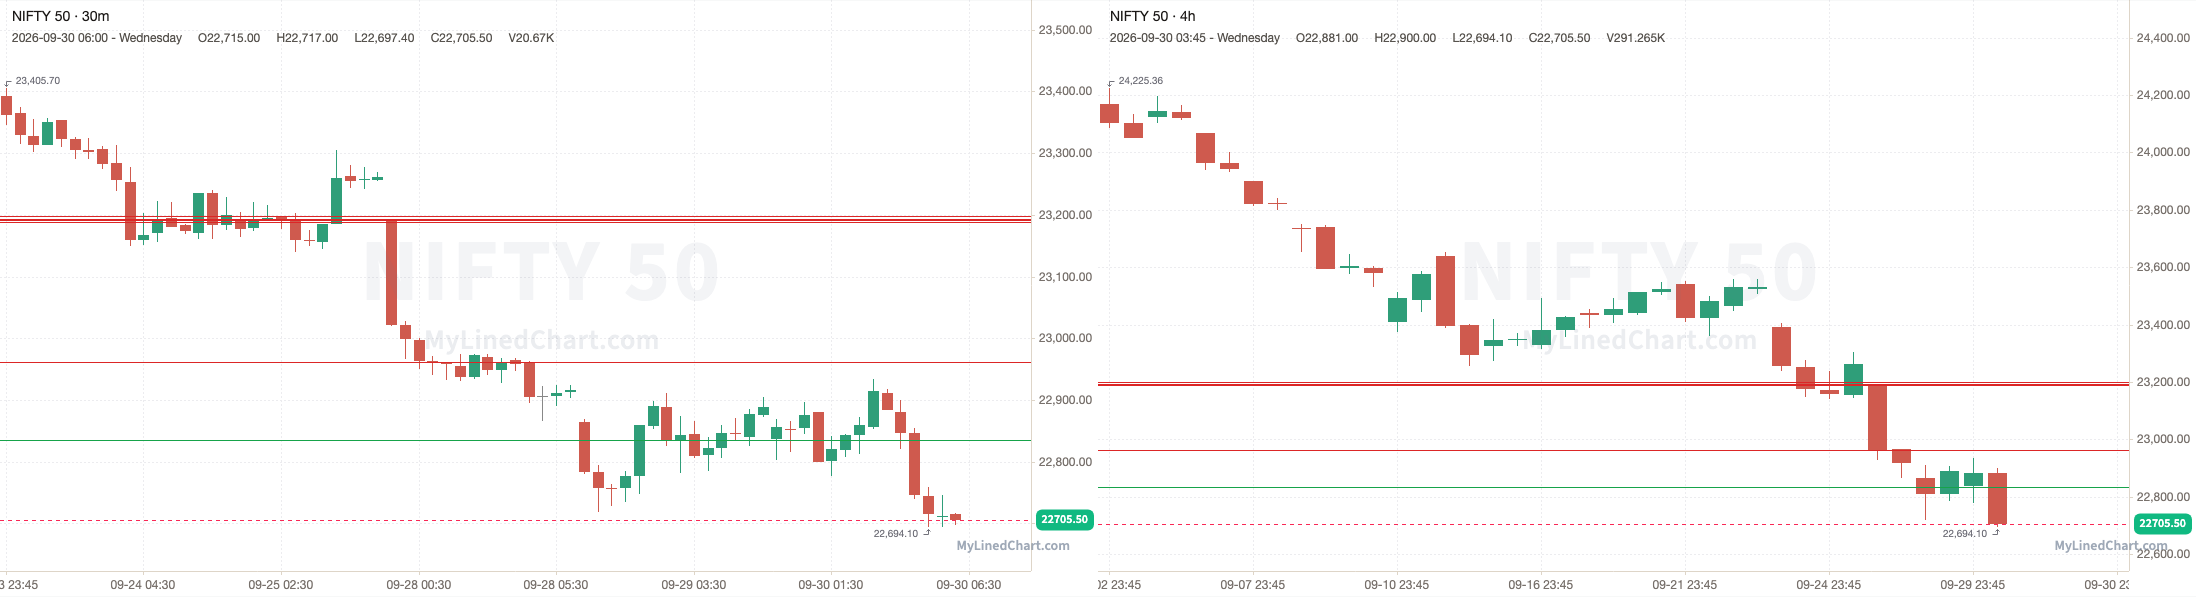
A recap of how the September 30th NIFTY 50 trading session and levels played out
NIFTY opened at 22836.50, dropped down and tagged 22835 and low at 22694.10, then ended up closing at 22705.50. Finishing the trading session down 0.57% intraday and down 0.80% overall.
September 30th session levels:
All listed levels: 22835, 22961.10, 23189, 23191.10, 23192.70, 23198.80
Resistance above: 22961.10, 23189, 23191.10, 23192.70, 23198.80
Support below: 22835
Nearest pivot: 22835
Above 22961.10 → 23189 next
Lose 22835 → open air
See the NIFTY 50 trade plan on Little Bird Trading
Australia: SPI
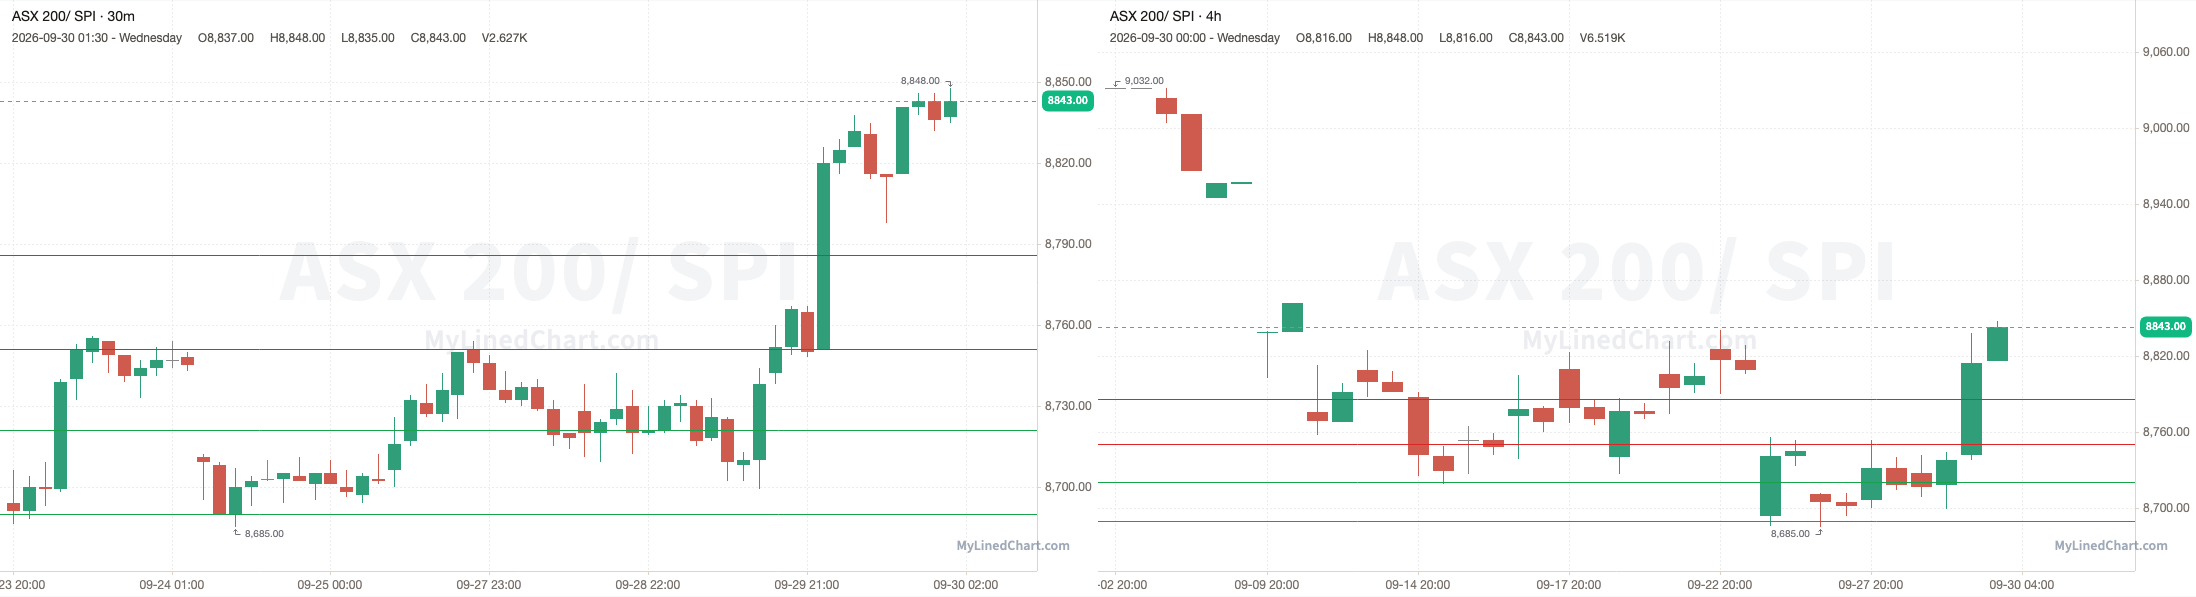
A recap of how the September 30th SPI trading session and levels played out
SPI opened at 8742, ran up and tagged the 8751 to 8786 zone and high at 8848, then ended up closing at 8827. Finishing the trading session up 0.97% intraday and up 1.00% overall.
September 30th session levels:
All listed levels: 8690, 8721, 8751, 8786
Resistance above: 8751, 8786
Support below: 8721, 8690
Nearest pivot: 8751
Above 8751 → 8786 next
Lose 8721 → 8690 next
See the SPI trade plan on Little Bird Trading
Europe
Germany: DAX 40
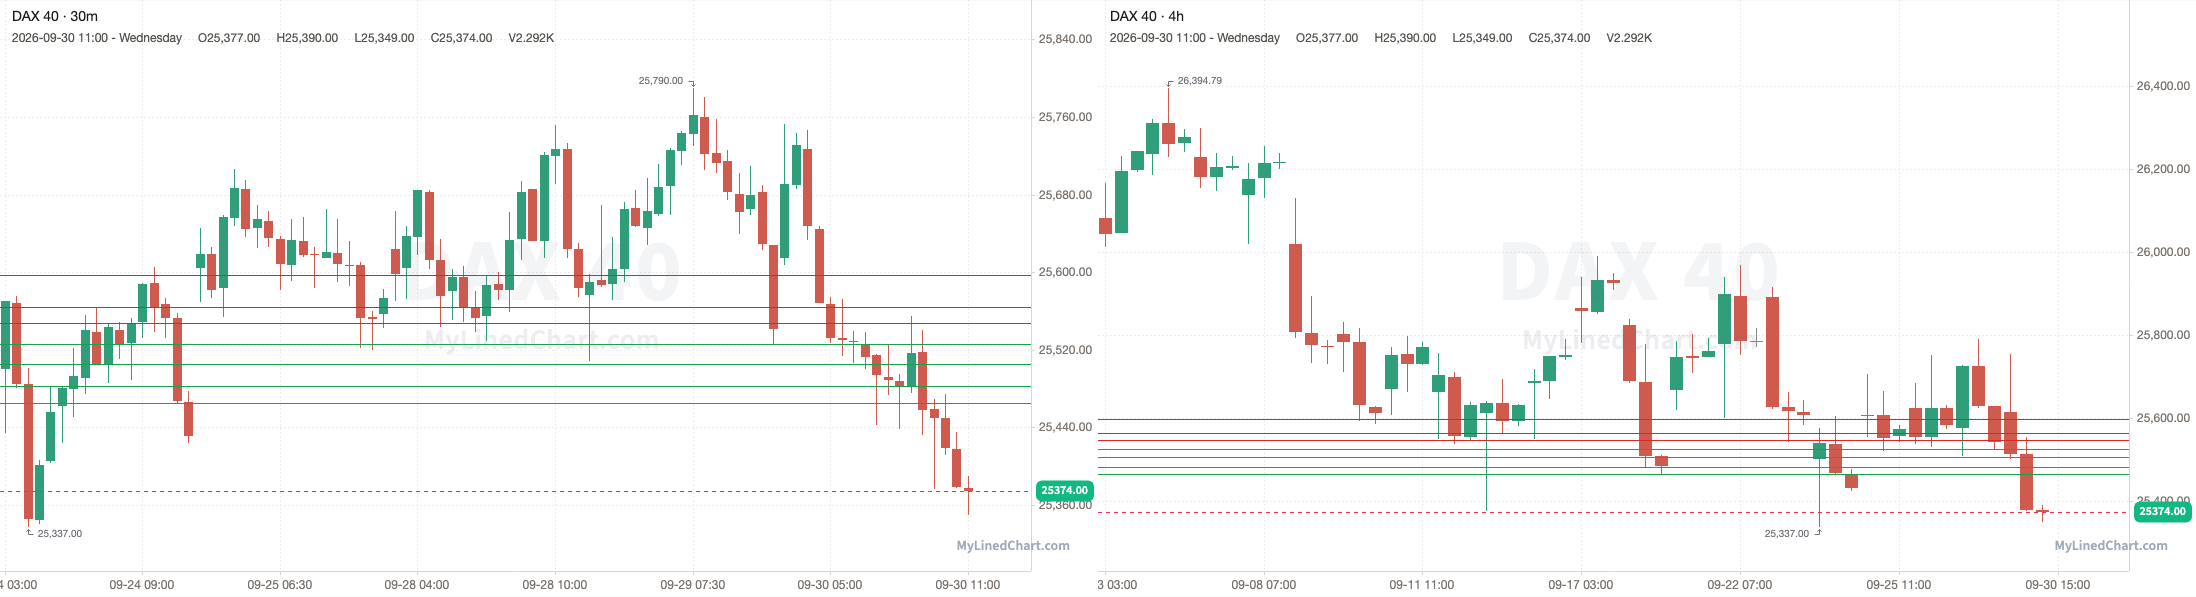
A recap of how the September 30th DAX 40 trading session and levels played out
DAX 40 opened at 25614, dropped down and tagged the 25465 to 25482 zone and low at 25349, then ended up closing at 25374. Finishing the trading session down 0.94% intraday and down 0.65% overall.
September 30th session levels:
All listed levels: 25465, 25482, 25505, 25526, 25547, 25564, 25597
Resistance above: 25547, 25564, 25597
Support below: 25526, 25505, 25482, 25465
Nearest pivot: 25547
Above 25547 → 25564 next
Lose 25526 → 25505 next
See the DAX 40 trade plan on Little Bird Trading
Eurozone: Euro Stoxx 50
A recap of how the September 30th Euro Stoxx 50 trading session and levels played out
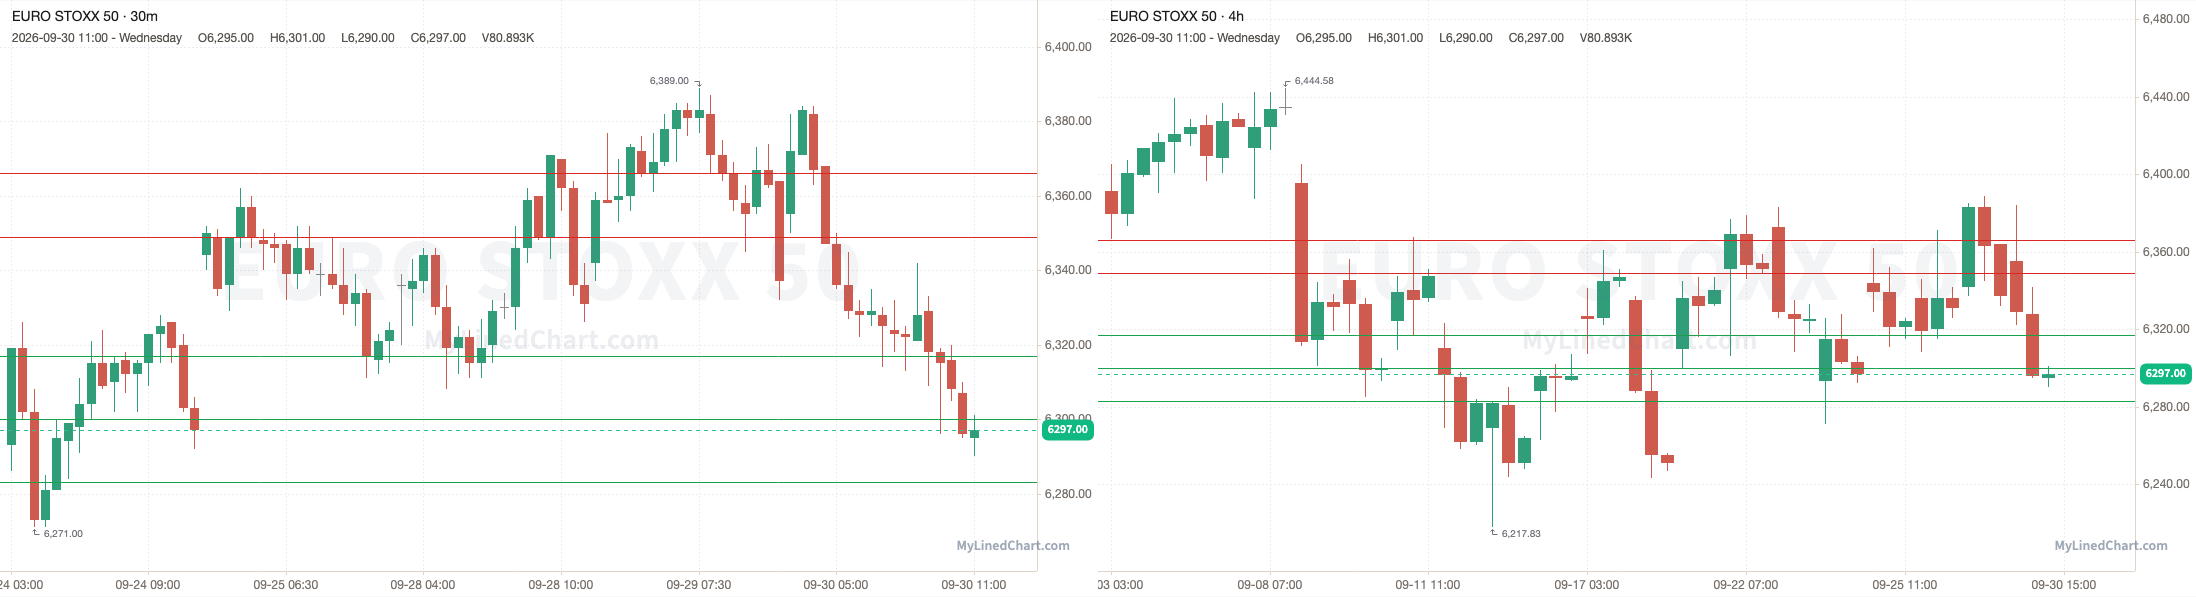
Euro Stoxx 50 opened at 6355, dropped down and tagged the 6300 to 6317 zone and low at 6290, then ended up closing at 6297. Finishing the trading session down 0.91% intraday and down 0.63% overall.
September 30th session levels:
All listed levels: 6283, 6300, 6317, 6349, 6366
Resistance above: 6349, 6366
Support below: 6317, 6300, 6283
Nearest pivot: 6349
Above 6349 → 6366 next
Lose 6317 → 6300 next
See the Euro Stoxx 50 trade plan on Little Bird Trading
UK: FTSE 100
A recap of how the September 30th FTSE 100 trading session and levels played out
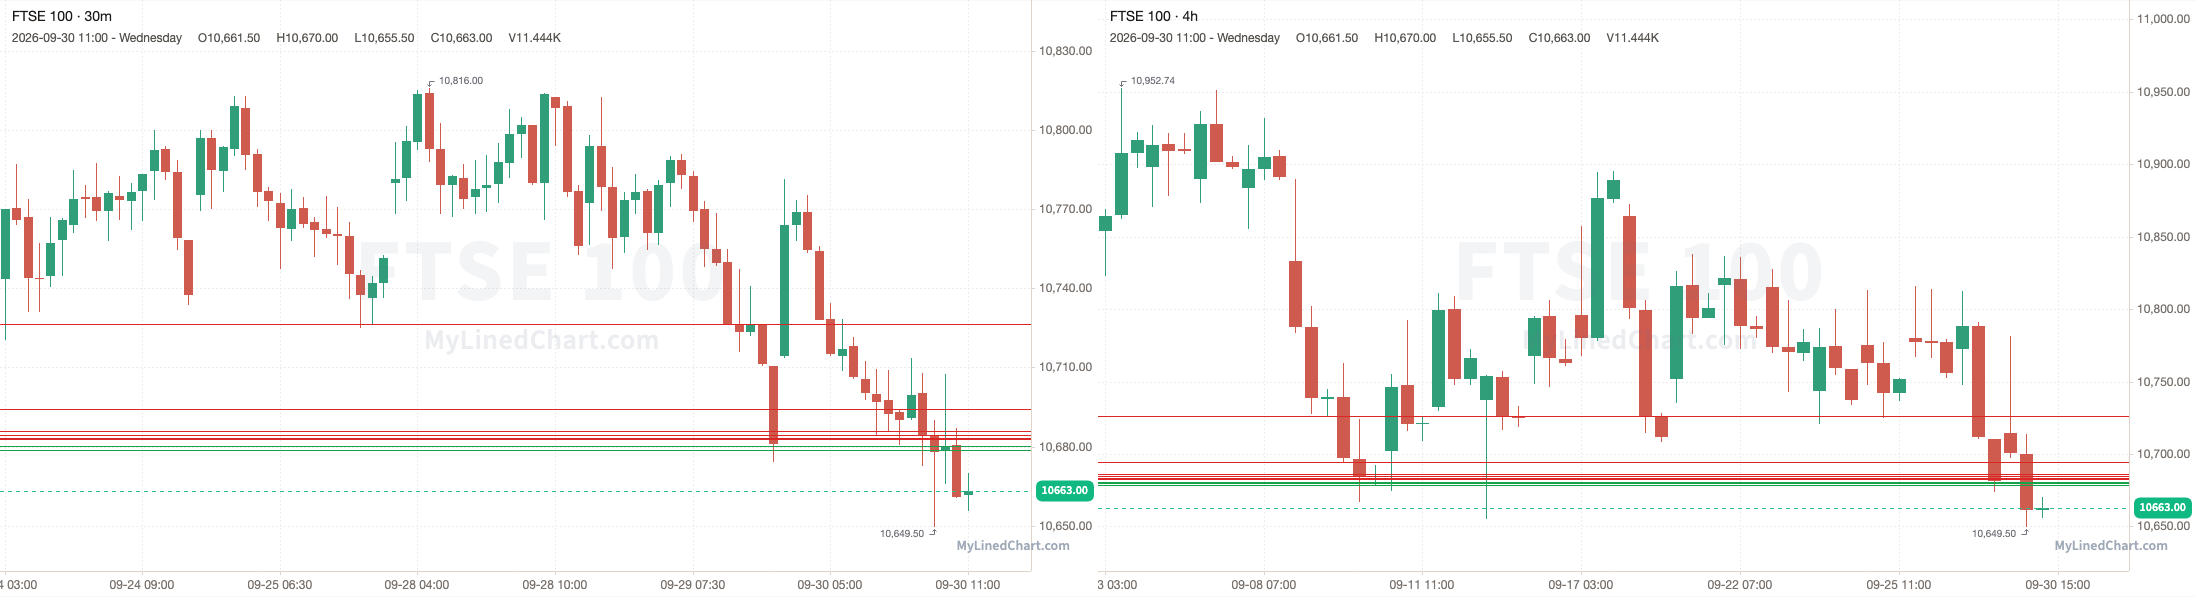
FTSE 100 opened at 10714.50, dropped down and tagged the 10678.88 to 10680.05 zone and low at 10649.50, then ended up closing at 10663. Finishing the trading session down 0.48% intraday and down 0.17% overall.
September 30th session levels:
All listed levels: 10678.88, 10680.05, 10680.40, 10682.92, 10683.42, 10684.58, 10686.08, 10694.14, 10726.50
Resistance above: 10682.92, 10683.42, 10684.58, 10686.08, 10694.14, 10726.50
Support below: 10680.40, 10680.05, 10678.88
Nearest pivot: 10680.40
Above 10682.92 → 10683.42 next
Lose 10680.40 → 10680.05 next
See the FTSE 100 trade plan on Little Bird Trading
France: CAC 40
A recap of how the September 30th CAC 40 trading session and levels played out
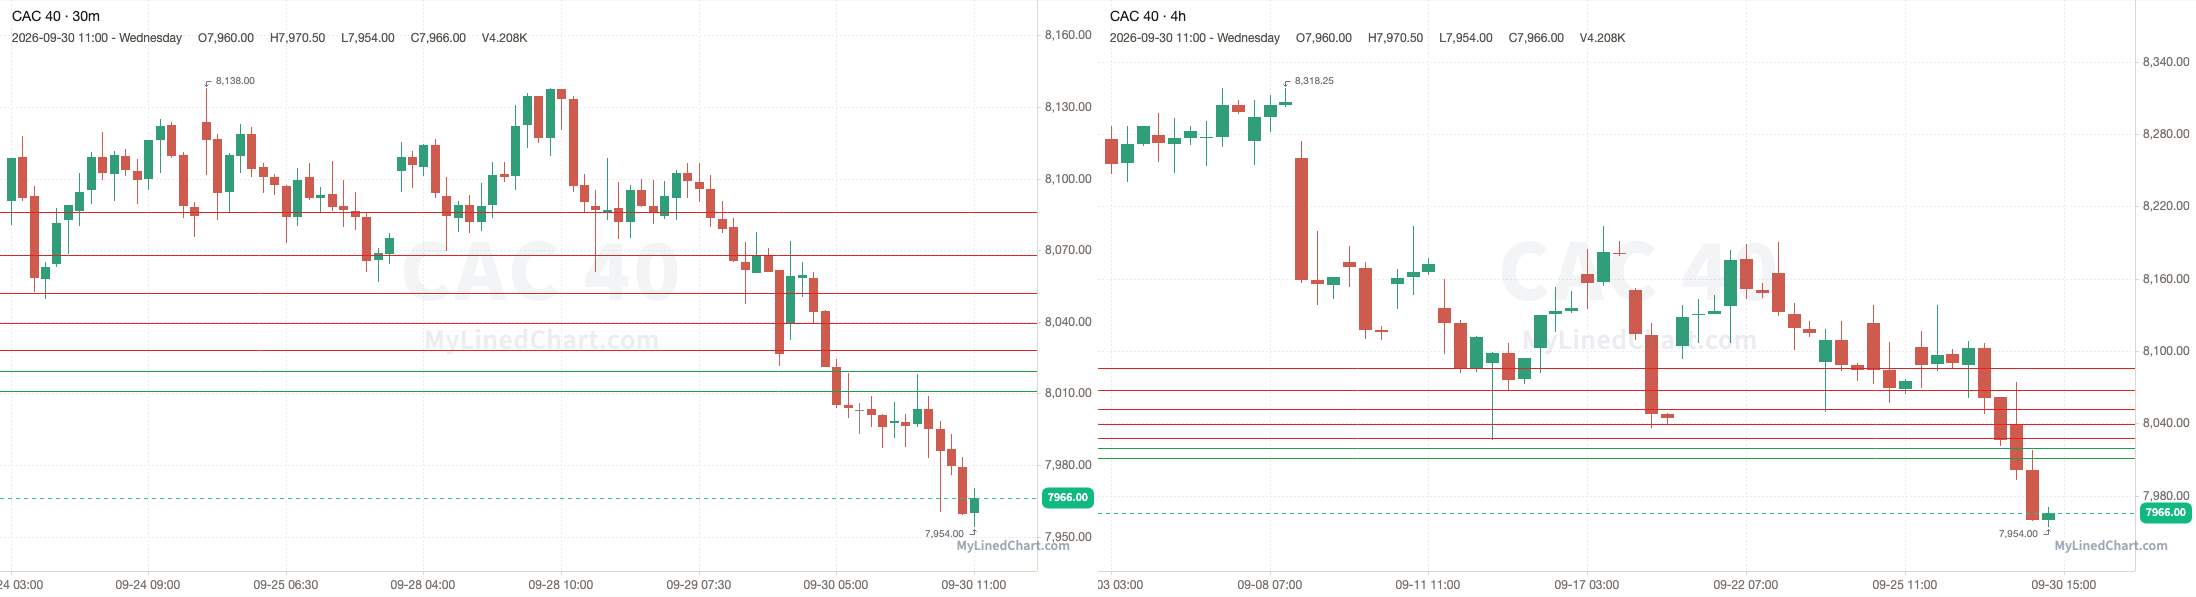
CAC 40 opened at 8039, dropped down and tagged the 8011 to 8019.50 zone and low at 7954, then ended up closing at 7966. Finishing the trading session down 0.91% intraday and down 0.75% overall.
September 30th session levels:
All listed levels: 8011, 8019.50, 8028, 8039.50, 8052, 8068, 8086
Resistance above: 8028, 8039.50, 8052, 8068, 8086
Support below: 8019.50, 8011
Nearest pivot: 8028
Above 8028 → 8039.50 next
Lose 8019.50 → 8011 next
See the CAC 40 trade plan on Little Bird Trading
Spain: IBEX 35
A recap of how the September 30th IBEX 35 trading session and levels played out
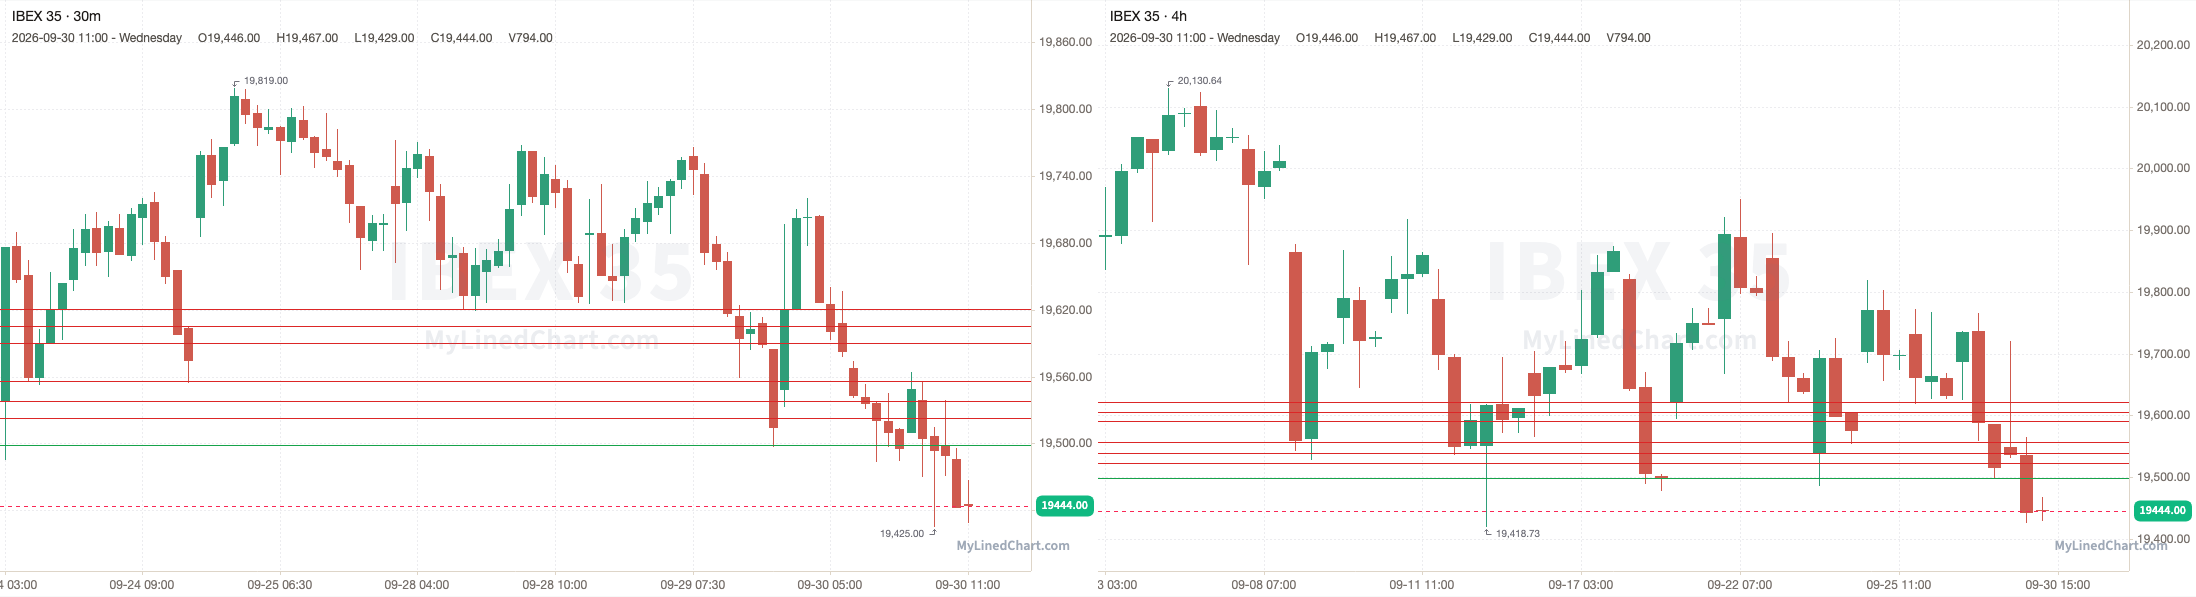
IBEX 35 opened at 19548, dropped down and tagged the 19499 to 19523 zone and low at 19425, then ended up closing at 19444. Finishing the trading session down 0.53% intraday and down 0.36% overall.
September 30th session levels:
All listed levels: 19499, 19523, 19538, 19556, 19590, 19605, 19621
Resistance above: 19523, 19538, 19556, 19590, 19605, 19621
Support below: 19499
Nearest pivot: 19523
Above 19523 → 19538 next
Lose 19499 → open air
See the IBEX 35 trade plan on Little Bird Trading
Italy: FTSE MIB
A recap of how the September 30th FTSE MIB trading session and levels played out
FTSE MIB opened at 51590, dropped down and tagged the 51295 to 51395 zone and low at 51080, then ended up closing at 51195. Finishing the trading session down 0.77% intraday and down 0.66% overall.
September 30th session levels:
All listed levels: 51295, 51395, 51480, 51645, 51730, 51815
Resistance above: 51645, 51730, 51815
Support below: 51480, 51395, 51295
Nearest pivot: 51480
Above 51645 → 51730 next
Lose 51480 → 51395 next
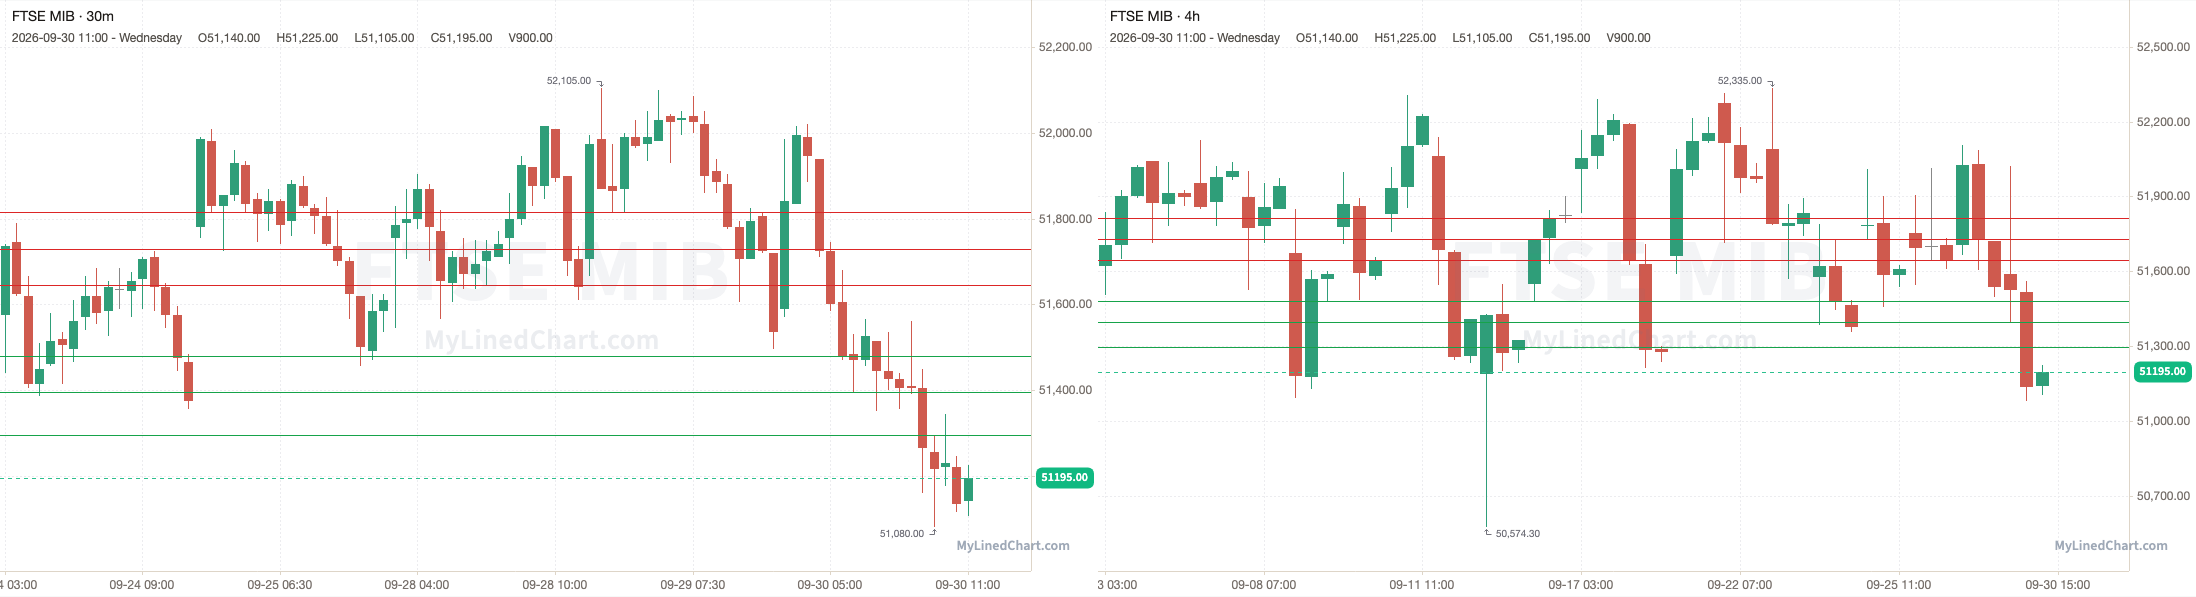
See the FTSE MIB trade plan on Little Bird Trading
Netherlands: AEX
A recap of how the September 30th AEX trading session and levels played out
AEX opened at 1123.90, dropped down and tagged the 1118.95 to 1119.85 zone and low at 1117.80, then ended up closing at 1119.15. Finishing the trading session down 0.42% intraday and down 0.19% overall.
September 30th session levels:
All listed levels: 1118.95, 1119.85, 1120.85, 1121.50, 1123.15, 1123.85, 1124.65, 1125.50
Resistance above: 1121.50, 1123.15, 1123.85, 1124.65, 1125.50
Support below: 1120.85, 1119.85, 1118.95
Nearest pivot: 1121.50
Above 1121.50 → 1123.15 next
Lose 1120.85 → 1119.85 next
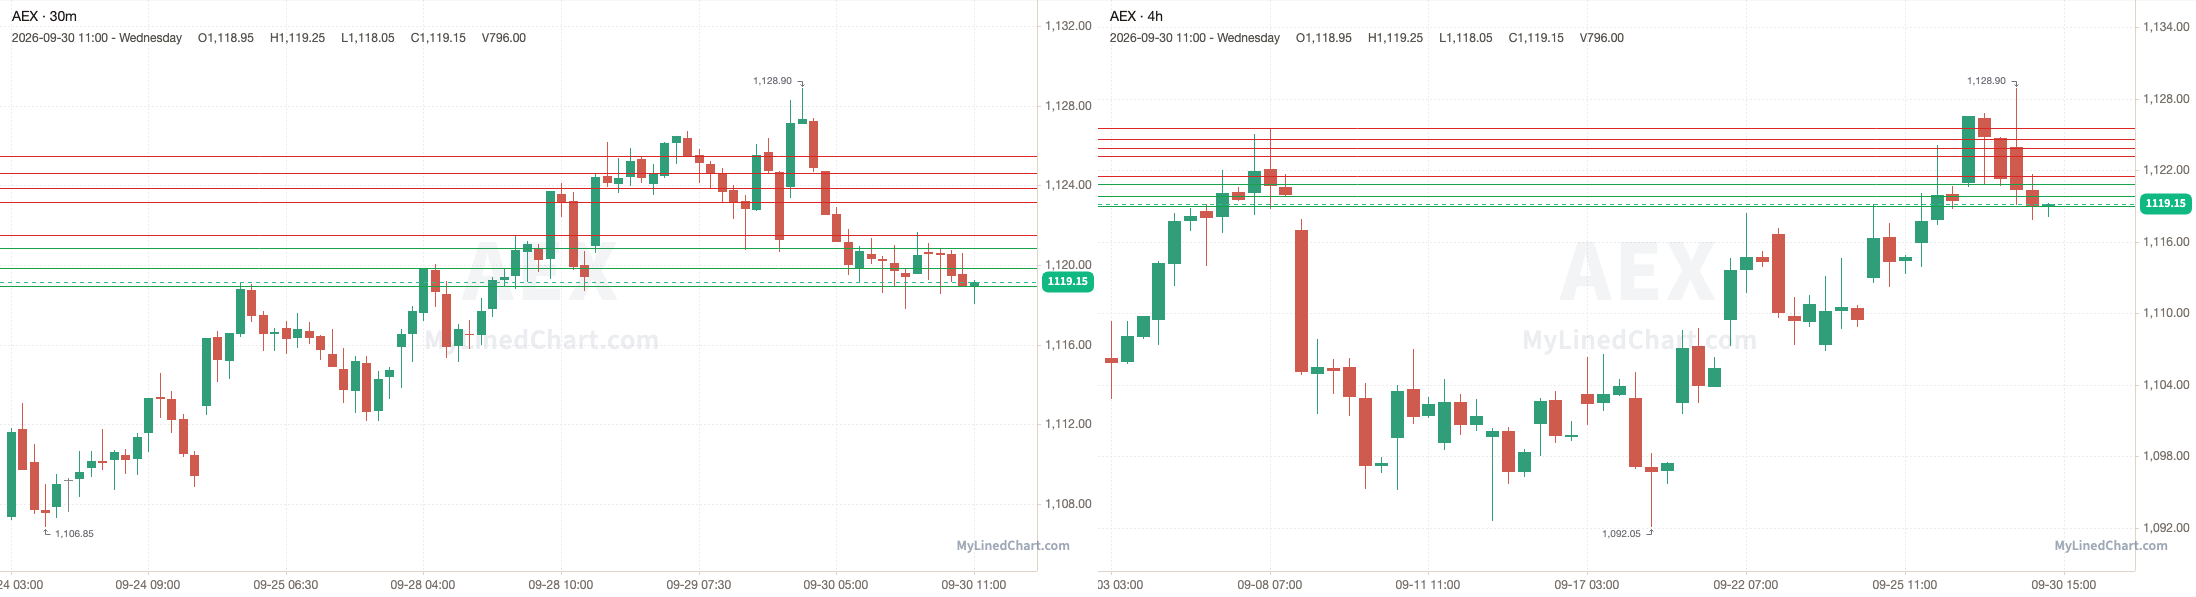
See the AEX trade plan on Little Bird Trading
Sweden: OMXS30
A recap of how the September 30th OMXS30 trading session and levels played out
OMXS30 opened at 3299.75, dropped down and tagged the 3278.25 to 3286 zone and low at 3275.50, then ended up closing at 3276. Finishing the trading session down 0.72% intraday and down 0.40% overall.
September 30th session levels:
All listed levels: 3278.25, 3286, 3290.25, 3294.50, 3299, 3303.50
Resistance above: 3290.25, 3294.50, 3299, 3303.50
Support below: 3286, 3278.25
Nearest pivot: 3290.25
Above 3290.25 → 3294.50 next
Lose 3286 → 3278.25 next
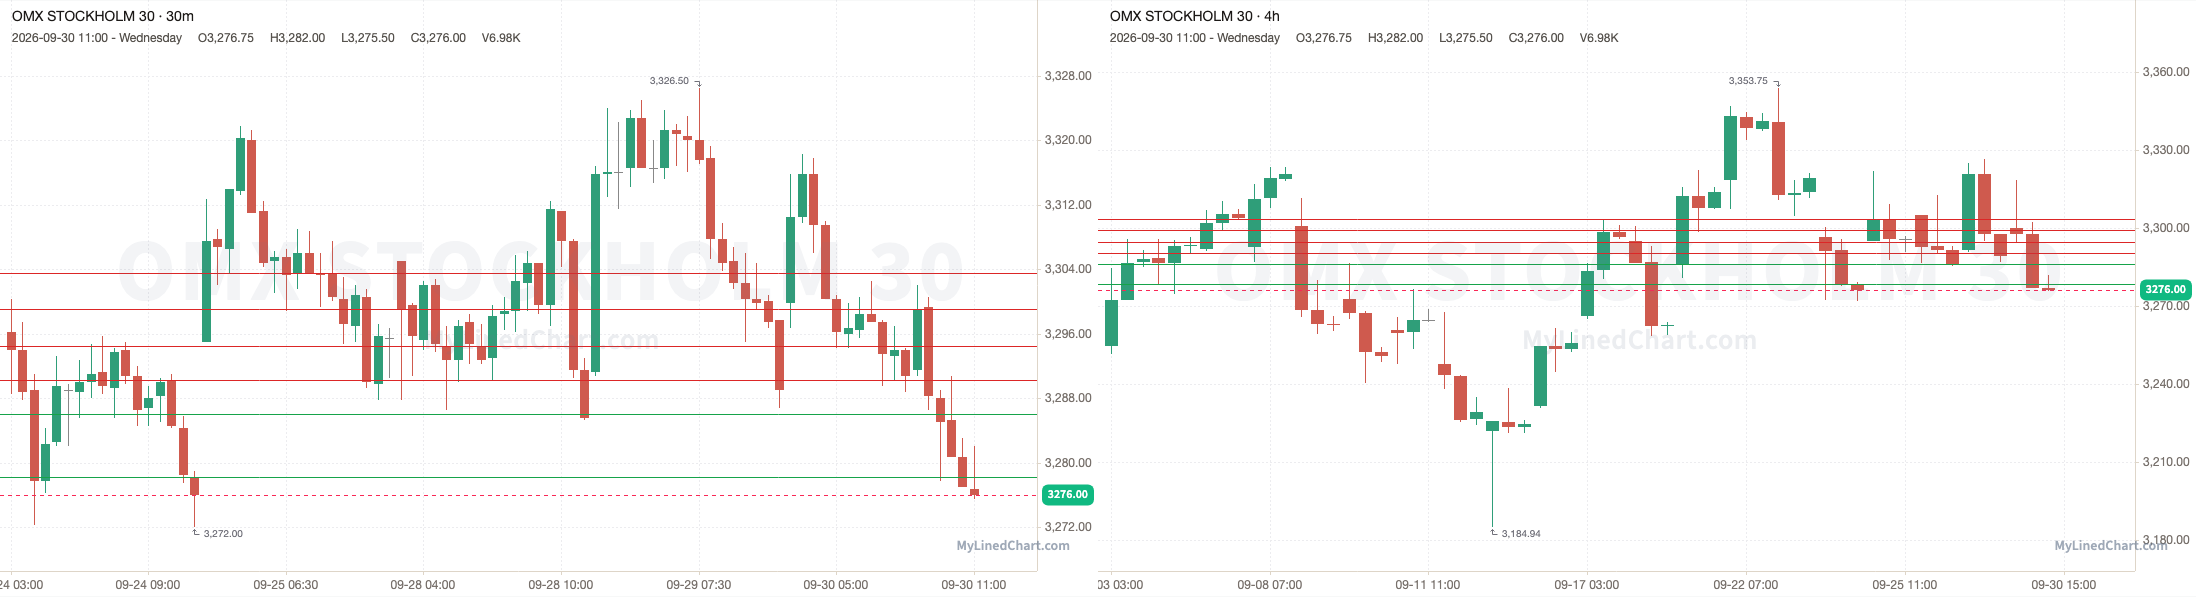
See the OMXS30 trade plan on Little Bird Trading
Switzerland: SMI
A recap of how the September 30th SMI trading session and levels played out
SMI opened at 13963, dropped down and tagged the 13883 to 13901 zone and low at 13829, then ended up closing at 13842. Finishing the trading session down 0.87% intraday and down 0.56% overall.
September 30th session levels:
All listed levels: 13883, 13901, 13919, 13955, 13972
Resistance above: 13955, 13972
Support below: 13919, 13901, 13883
Nearest pivot: 13919
Above 13955 → 13972 next
Lose 13919 → 13901 next
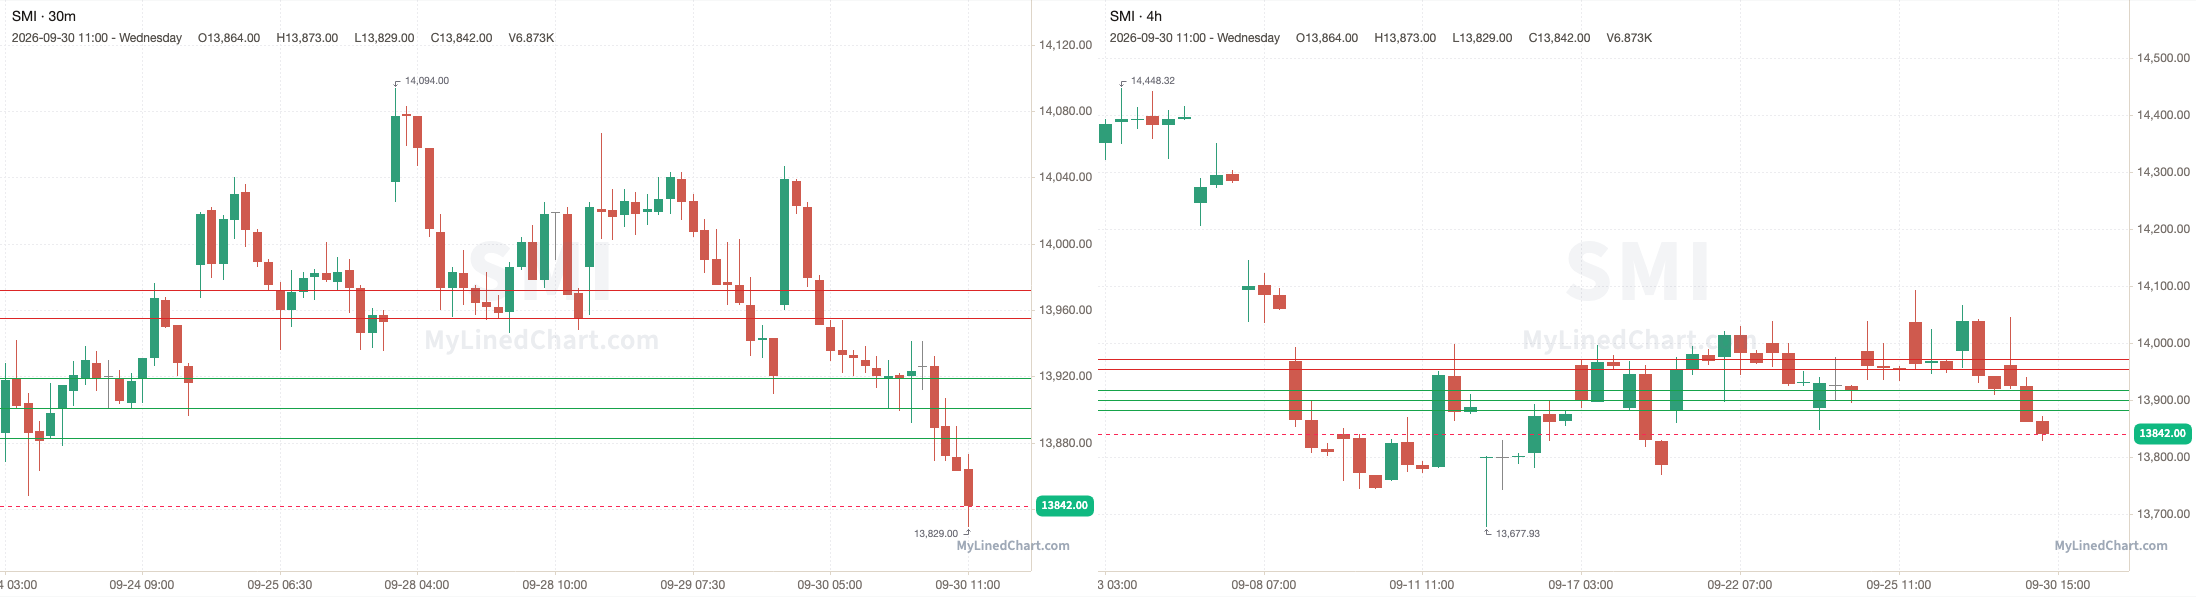
See the SMI trade plan on Little Bird Trading
Latin America
Mexico: S&P/BMV IPC
A recap of how the September 30th S&P/BMV IPC trading session and levels played out
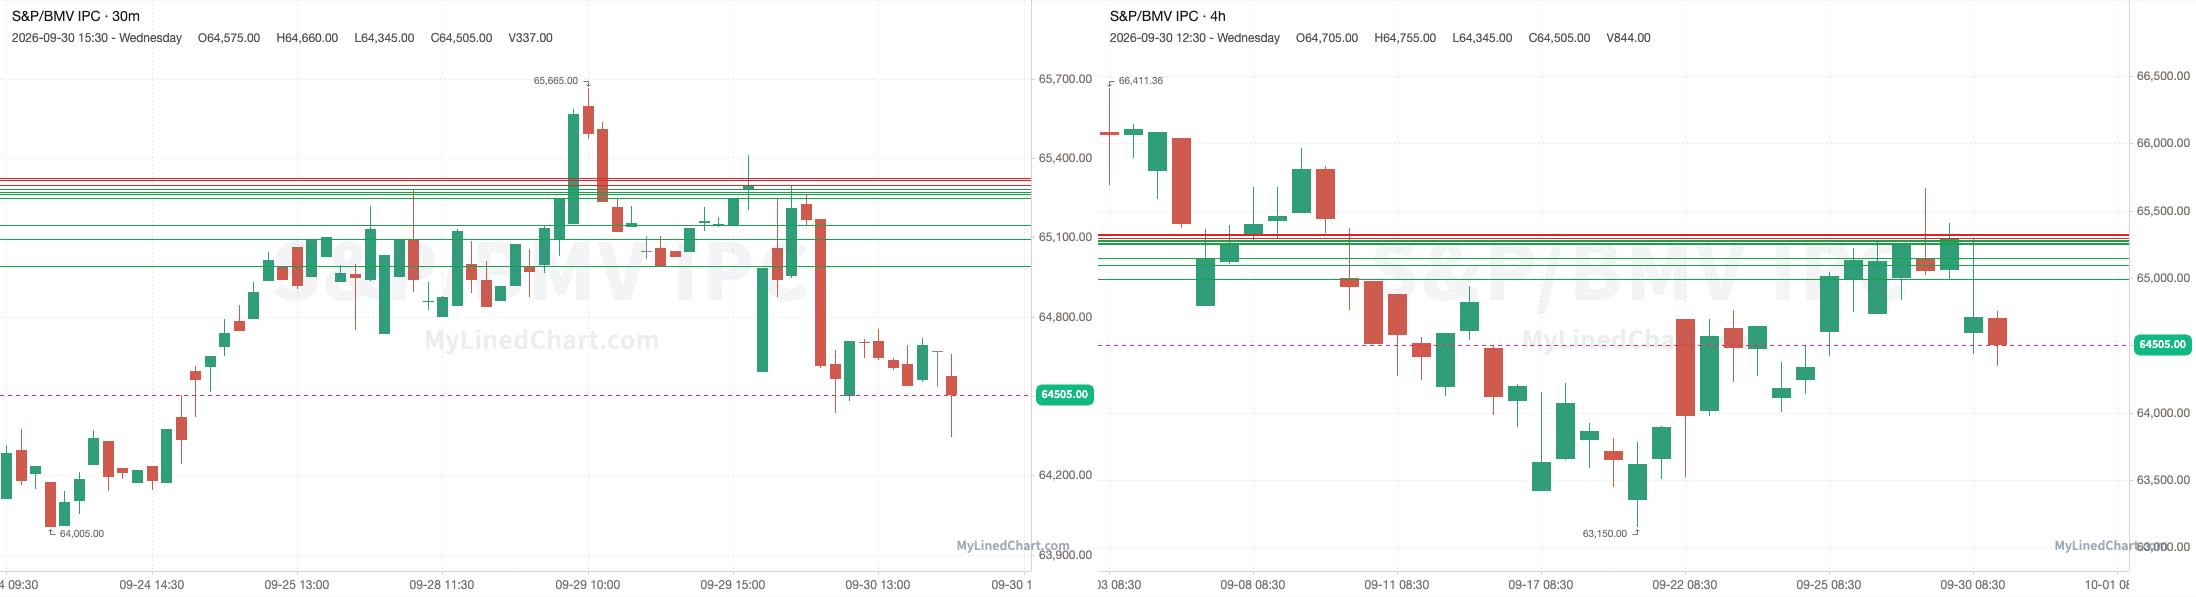
S&P/BMV IPC opened at 64590, dropped down and tagged the 64990 to 65095 zone and low at 64345, then ended up closing at 64505. Finishing the trading session down 0.13% intraday and down 1.21% overall.
September 30th session levels:
All listed levels: 64990, 65095, 65145, 65250, 65263, 65273, 65282, 65296, 65318, 65323
Resistance above: 65296, 65318, 65323
Support below: 65282, 65273, 65263, 65250, 65145, 65095, 64990
Nearest pivot: 65296
Above 65296 → 65318 next
Lose 65282 → 65273 next
See the S&P/BMV IPC trade plan on Little Bird Trading
Brazil: Ibovespa
A recap of how the September 30th Ibovespa trading session and levels played out
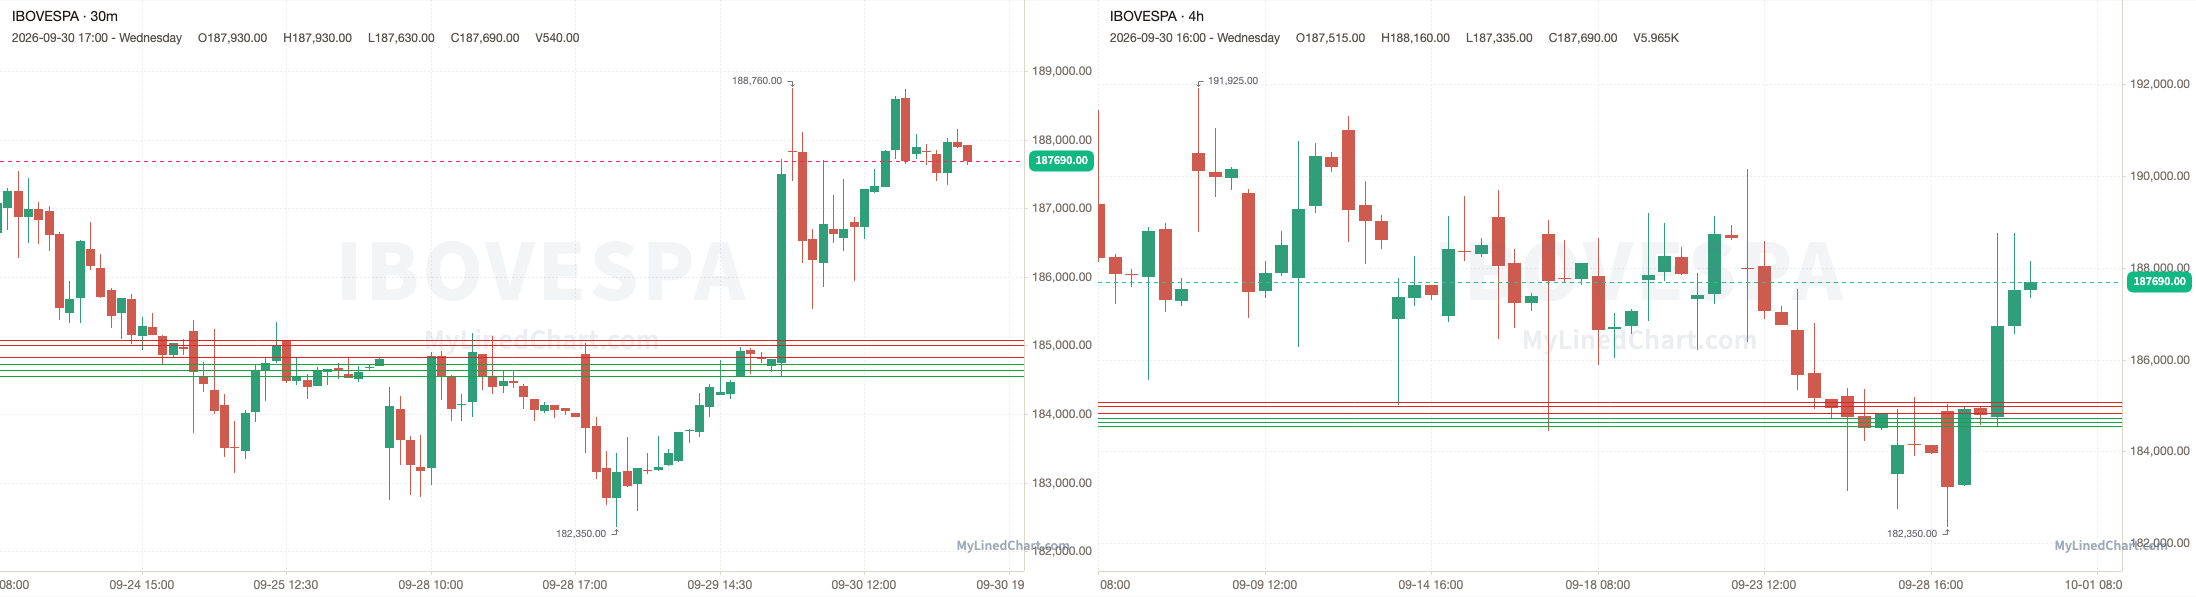
Ibovespa opened at 184750, ran up and tagged the 185000 to 185085 zone and high at 188760, then ended up closing at 187690. Finishing the trading session up 1.59% intraday and up 1.56% overall.
September 30th session levels:
All listed levels: 184555, 184640, 184735, 184830, 185000, 185085
Resistance above: 184830, 185000, 185085
Support below: 184735, 184640, 184555
Nearest pivot: 184830
Above 184830 → 185000 next
Lose 184735 → 184640 next
See the Ibovespa trade plan on Little Bird Trading
Get each market's levels in real time as they're posted. Sign up on Little Bird Trading.
Pro: next-session levels for the markets you trade, on Little Bird Trading.
Disclaimer: Little Bird Trading and any of its associations may or may not, whether long or short, have a position in any instruments. Not investment advice. Provided for informational purposes only. Not a recommendation or endorsement. Not registered or licensed. Model portfolios are property of their respective owners. All data is sourced from publicly available information. No guarantee is being made or offered. Not responsible for financial loss or ruin. Little Bird Trading may earn a commission if you purchase through links on the site.
Day Trade Levels for the October 1st Trading Session:
Enjoying this content?
Subscribe on Substack