

SPY, DAX +18 Global Market Levels: Oct 8th Trade Plan Plus Charts
Support, resistance and pivot levels for SPY, ES, QQQ, NQ and 19 stock markets across Asia, Europe and the Americas ahead of the October 8th session, plus how the last session's levels traded.
Little Bird Trading is in 15+ languages. View this report in:
Deutsch · 日本語 · Español (España) · Español · 한국어 · 简体中文 · हिन्दी · Français · Português (Brasil) · Português (Portugal) · 繁體中文 · Italiano · Nederlands · Svenska
MyLinedChart works however you get to a trade: AI-Assisted, Discretionary, Quant, or Macro. Export your lines, levels plus the whole chart as XLSX, JSON, or CSV. Or, let AI do all the work for you.
Here’s an overview of how MyLinedChart compares to TradingView and TrendSpider. Available on Windows, Apple and Android.
Looking for a pro to build your trading workflows? Reach out on Upwork.
Get each market's levels in real time as they're posted. Sign up on Little Bird Trading.
US
A recap of how the October 7th trading session and levels played out
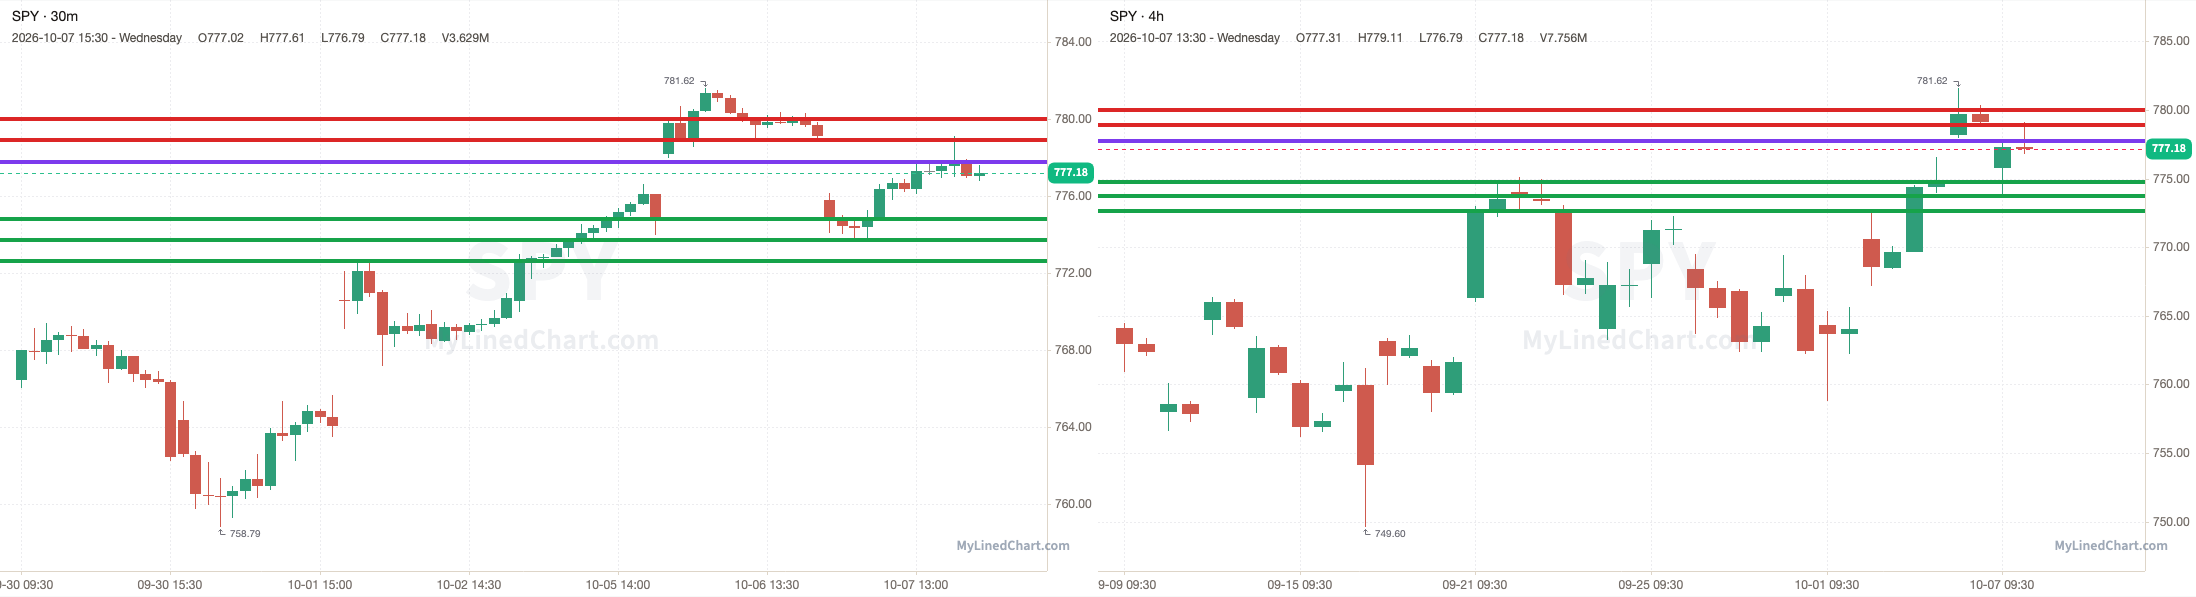
SPY opened at 775.77, broke above the 778.93 pivot and pushed to a high of 779.11, then ended up closing at 777.18. SPY finished up 0.18% intraday and down 0.25% overall.
October 7th session levels:
All listed levels: 772.63, 773.71, 774.78, 777.78, 778.93, 779.99
Resistance above: 779.99
Support below: 778.93, 777.78, 774.78, 773.71, 772.63
Nearest pivot: 778.93
Above 779.99 → open air
Lose 778.93 → 777.78 next
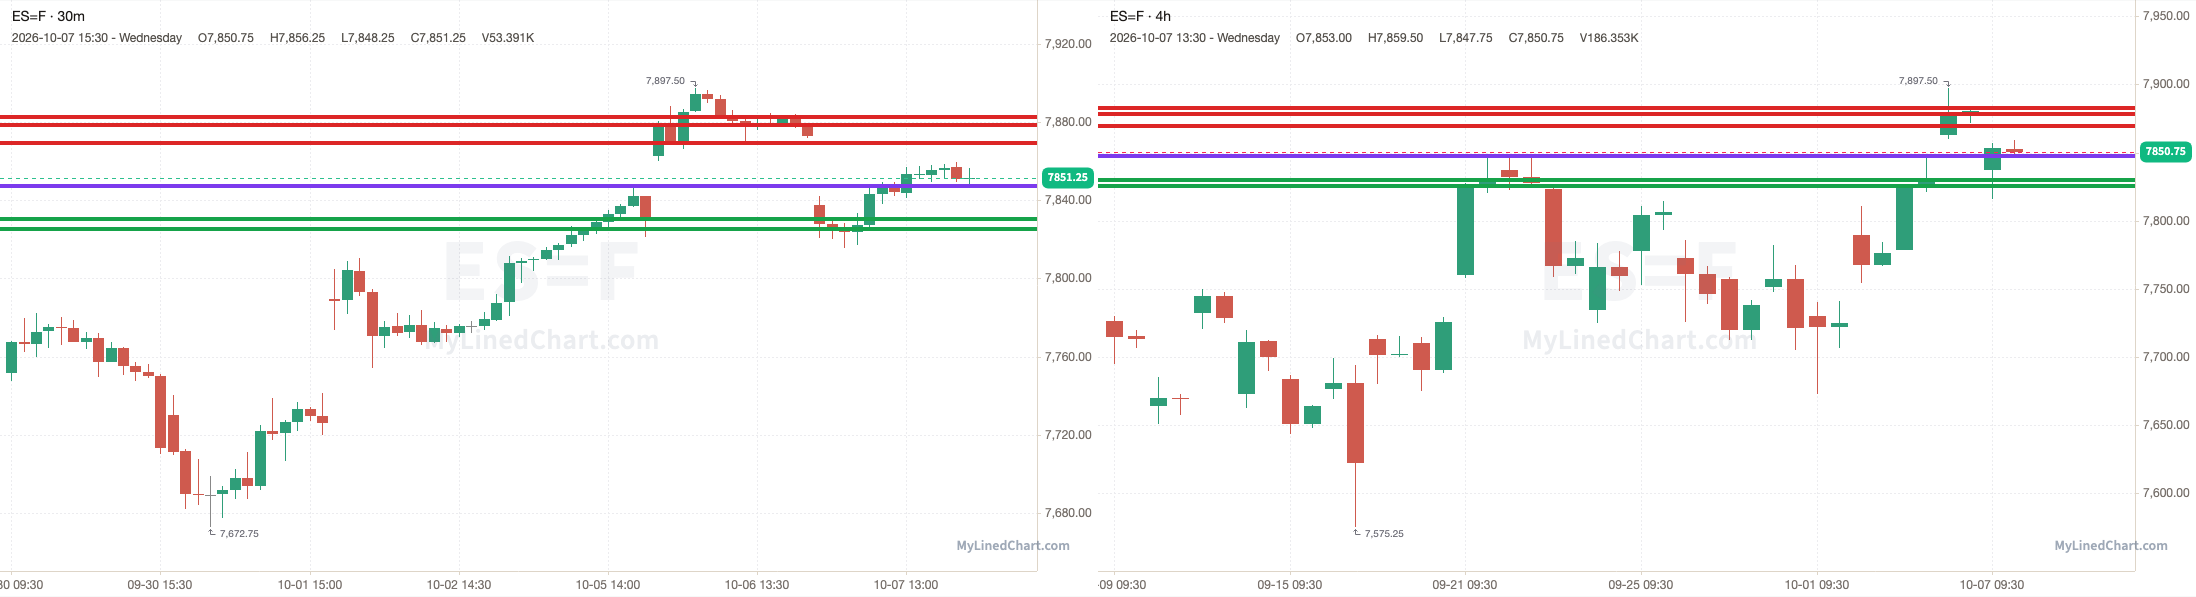
ES opened at 7837.50, stayed under the 7882.50 pivot and pushed to a high of 7859.50, then ended up closing at 7850.75. ES finished up 0.17% intraday and down 0.38% overall.
October 7th session levels:
All listed levels: 7825.50, 7830.25, 7847.25, 7869.50, 7878.25, 7882.50
Resistance above: 7882.50
Support below: 7878.25, 7869.50, 7847.25, 7830.25, 7825.50
Nearest pivot: 7882.50
Above 7882.50 → open air
Lose 7878.25 → 7869.50 next
See the SPY, ES, QQQ & NQ trade plan on Little Bird Trading
Asia
Japan: Nikkei 225
A recap of how the October 7th Nikkei 225 trading session and levels played out
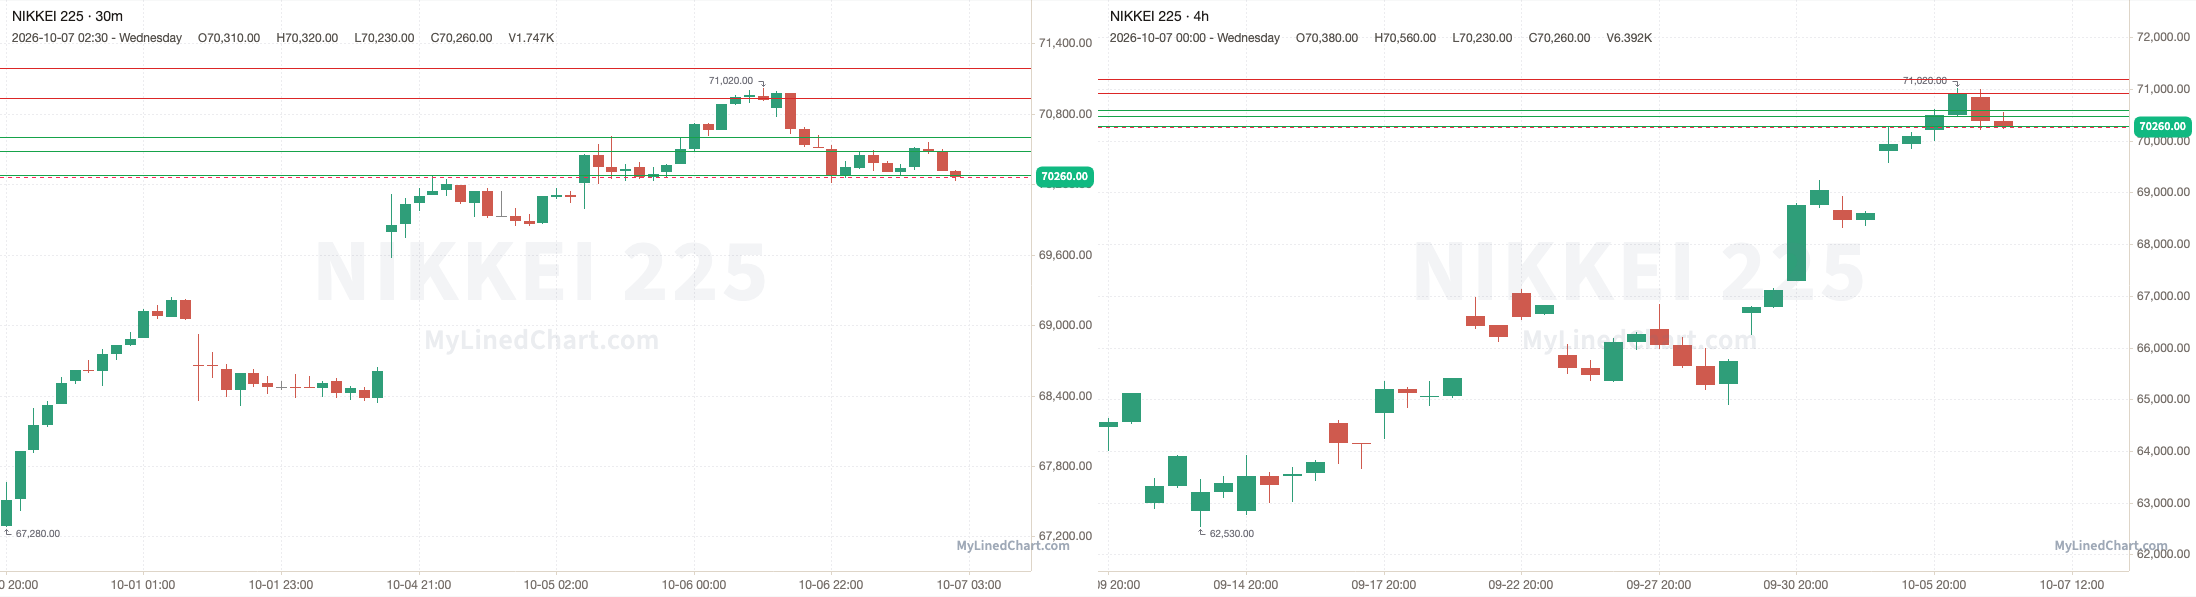
Nikkei 225 opened at 70850, popped above the 70930 pivot to a high of 70990, then lost it and ran through every support level down to 70280, and kept going to a low of 70210, then ended up closing at 70260. Finishing the trading session down 0.83% intraday.
October 7th session levels:
All listed levels: 70280, 70480, 70600, 70930, 71190
Resistance above: 70930, 71190
Support below: 70600, 70480, 70280
Nearest pivot: 70930
Above 70930 → 71190 next
Lose 70600 → 70480 next
See the Nikkei 225 trade plan on Little Bird Trading
Korea: KOSPI 200
A recap of how the October 7th KOSPI 200 trading session and levels played out
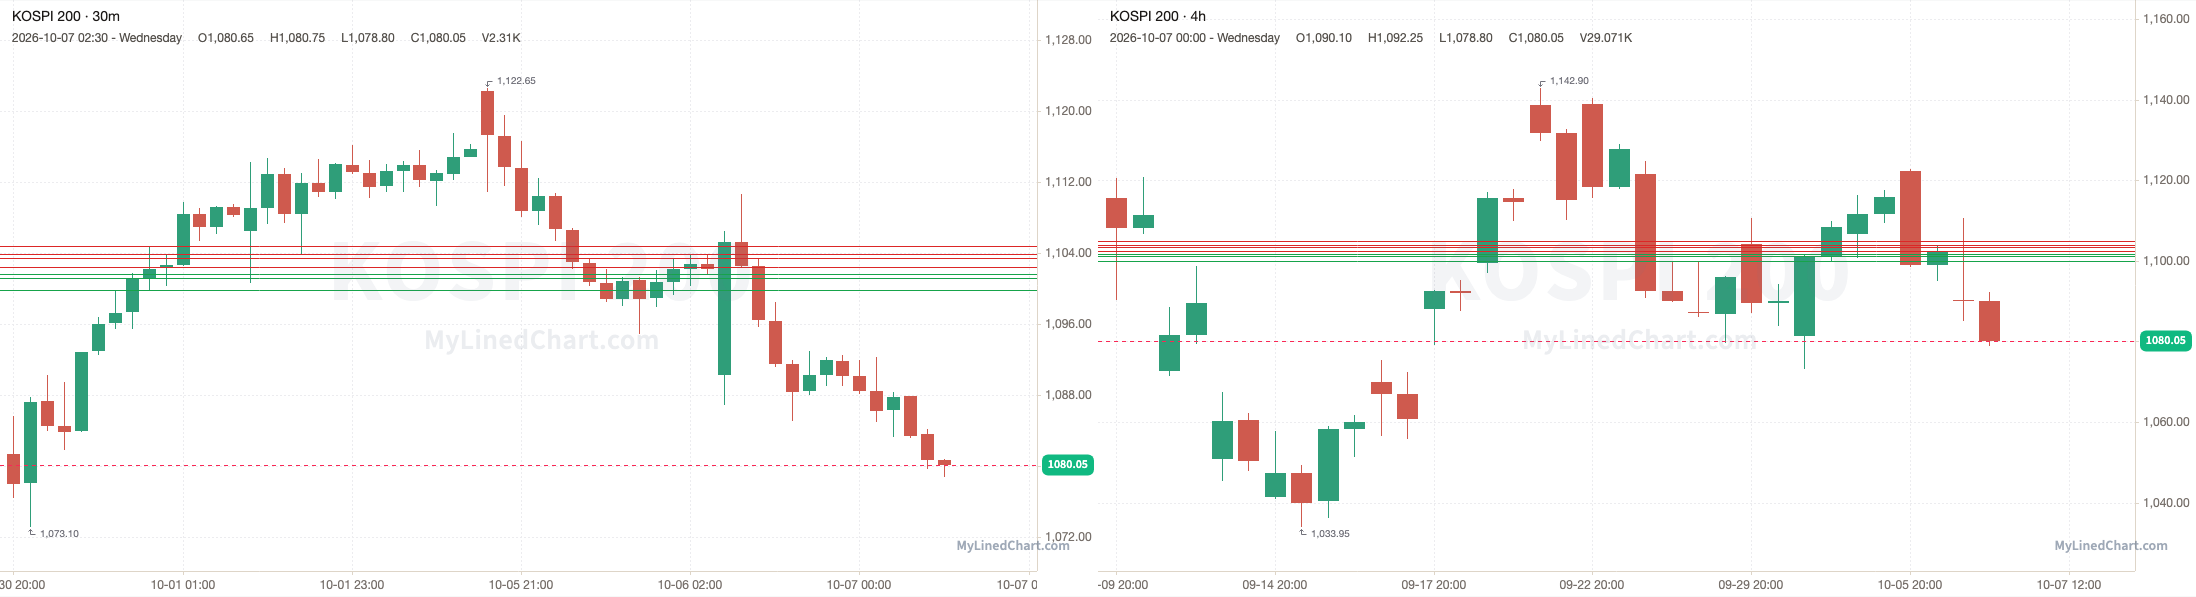
KOSPI 200 opened at 1090.20, popped above the 1102.40 pivot to a high of 1110.65, then lost it and dropped to a low of 1078.80, then ended up closing at 1080.05. Finishing the trading session down 0.93% intraday.
October 7th session levels:
All listed levels: 1099.85, 1101.25, 1101.65, 1102.40, 1103.40, 1103.85, 1104.85
Resistance above: 1102.40, 1103.40, 1103.85, 1104.85
Support below: 1101.65, 1101.25, 1099.85
Nearest pivot: 1102.40
Above 1102.40 → 1103.40 next
Lose 1101.65 → 1101.25 next
See the KOSPI 200 trade plan on Little Bird Trading
China: FTSE China A50
A recap of how the October 7th FTSE China A50 trading session and levels played out
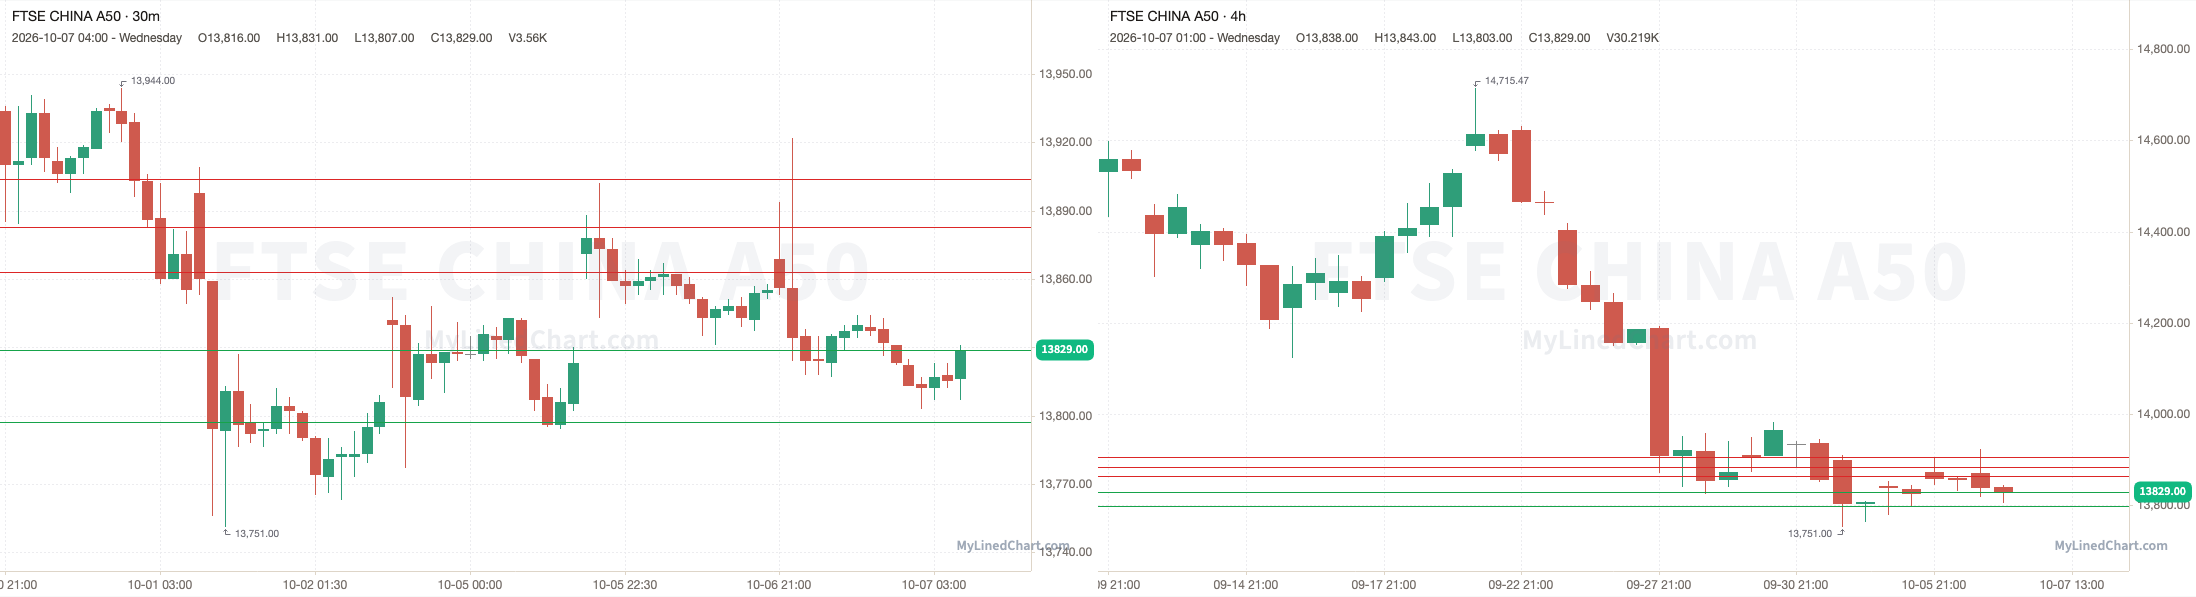
FTSE China A50 opened at 13869, broke below the 13863 pivot and dropped to tag 13829, with a low of 13803, then ended up closing at 13829. Finishing the trading session down 0.29% intraday.
October 7th session levels:
All listed levels: 13797, 13829, 13863, 13883, 13904
Resistance above: 13863, 13883, 13904
Support below: 13829, 13797
Nearest pivot: 13863
Above 13863 → 13883 next
Lose 13829 → 13797 next
See the FTSE China A50 trade plan on Little Bird Trading
Hong Kong: Hang Seng
A recap of how the October 7th Hang Seng trading session and levels played out
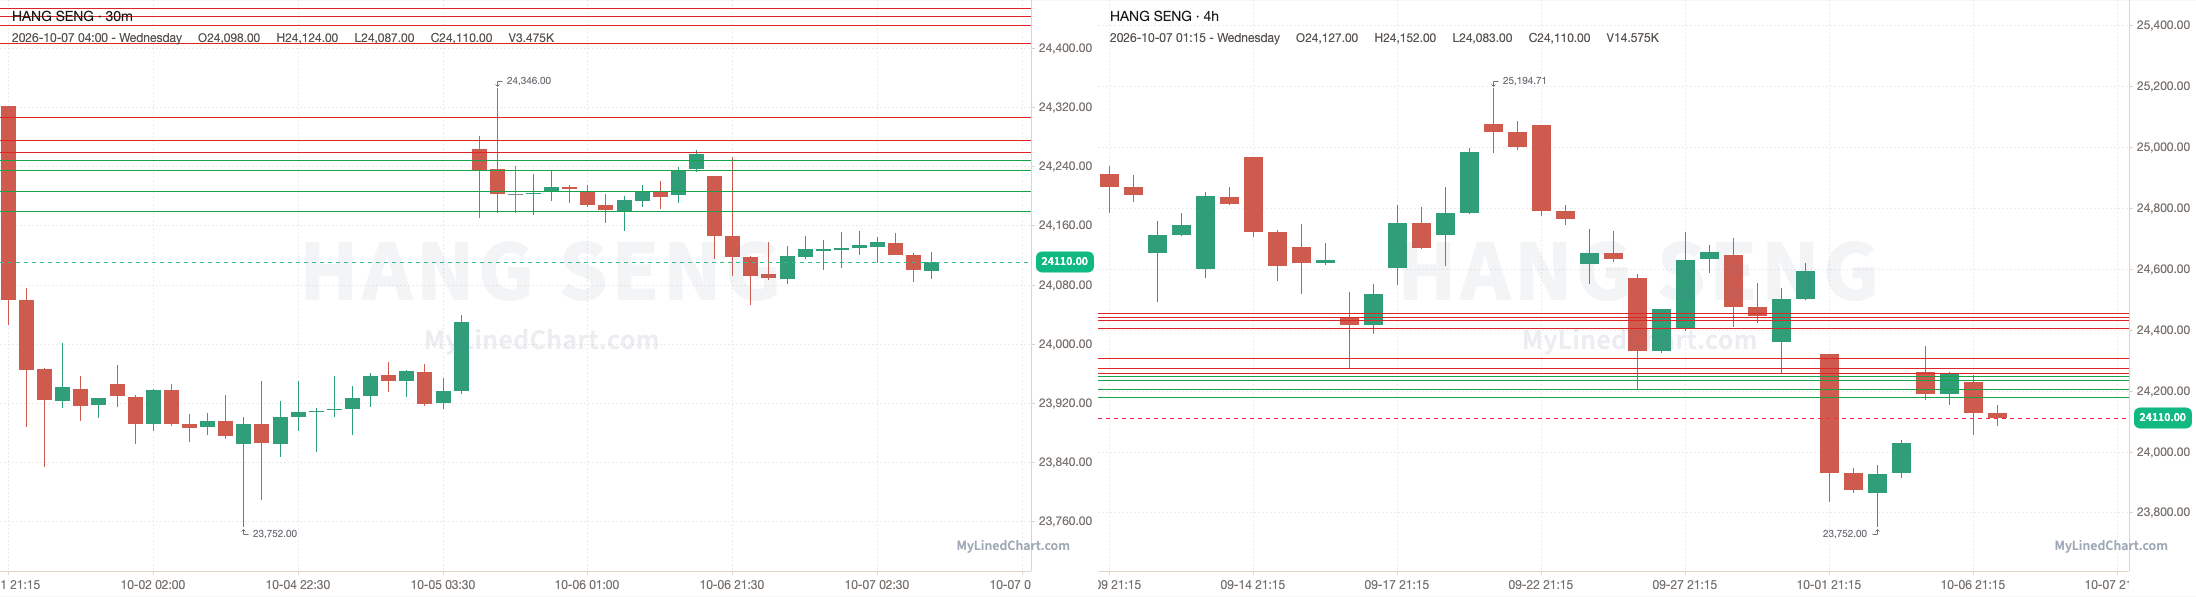
Hang Seng opened at 24227, stayed under the 24259 pivot and dropped to tag 24179, with a low of 24053, then ended up closing at 24110. Finishing the trading session down 0.48% intraday.
October 7th session levels:
All listed levels: 24179, 24206, 24235, 24248, 24259, 24276, 24306, 24407, 24431, 24443, 24454
Resistance above: 24259, 24276, 24306, 24407, 24431, 24443, 24454
Support below: 24248, 24235, 24206, 24179
Nearest pivot: 24259
Above 24259 → 24276 next
Lose 24248 → 24235 next
See the Hang Seng trade plan on Little Bird Trading
Taiwan: FTSE Taiwan
A recap of how the October 7th FTSE Taiwan trading session and levels played out
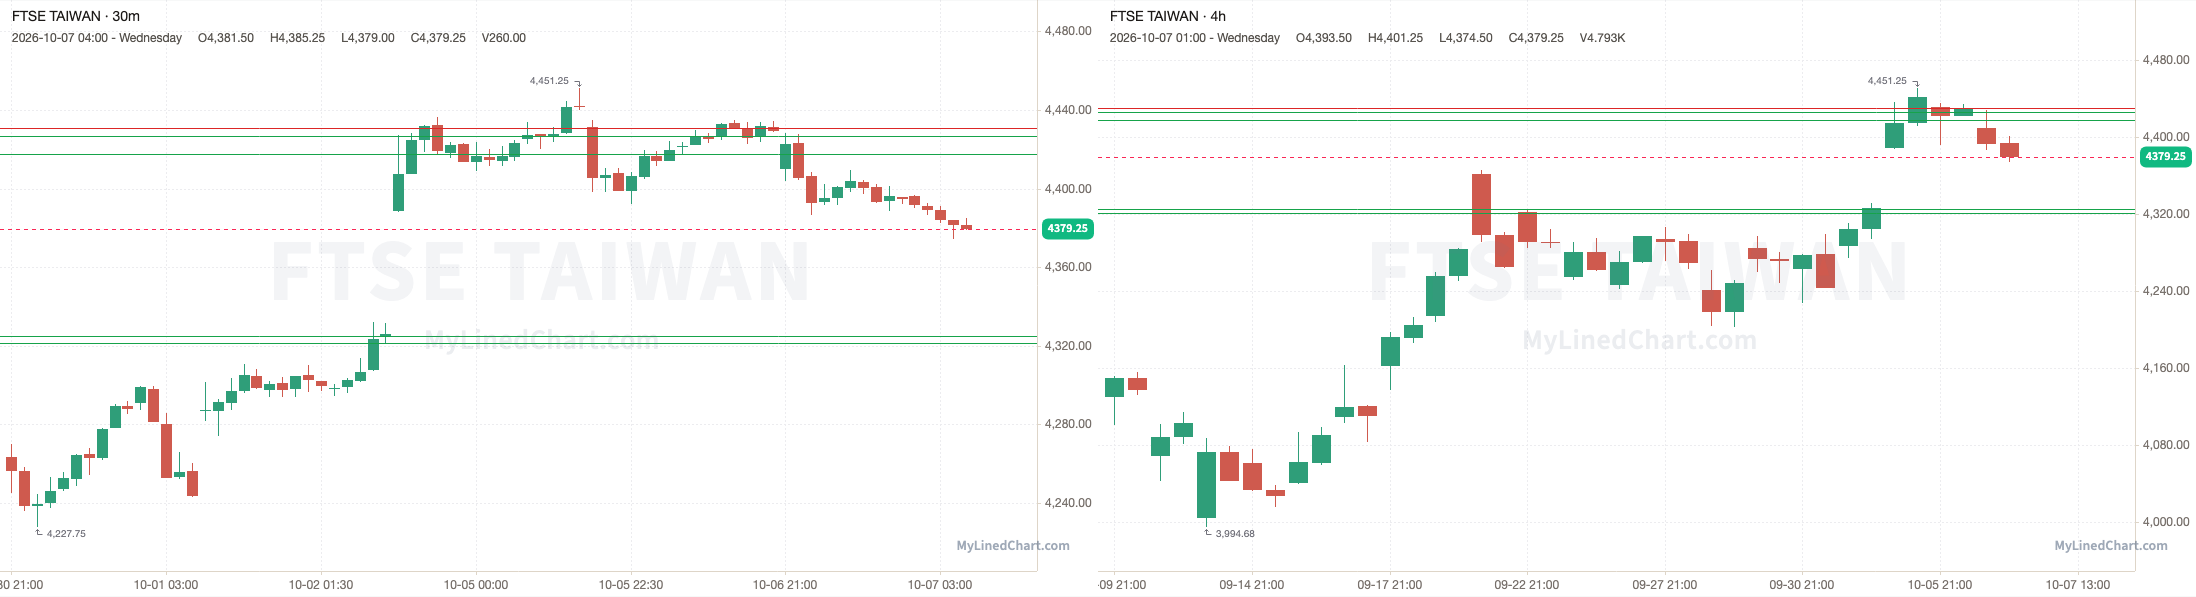
FTSE Taiwan opened at 4409.75, stayed under the 4430.75 pivot and dropped to a low of 4374.50, then ended up closing at 4379.25. Finishing the trading session down 0.69% intraday.
October 7th session levels:
All listed levels: 4321.25, 4325, 4417.50, 4426.50, 4430.75
Resistance above: 4430.75
Support below: 4426.50, 4417.50, 4325, 4321.25
Nearest pivot: 4430.75
Above 4430.75 → open air
Lose 4426.50 → 4417.50 next
See the FTSE Taiwan trade plan on Little Bird Trading
Singapore: MSCI Singapore
A recap of how the October 7th MSCI Singapore trading session and levels played out
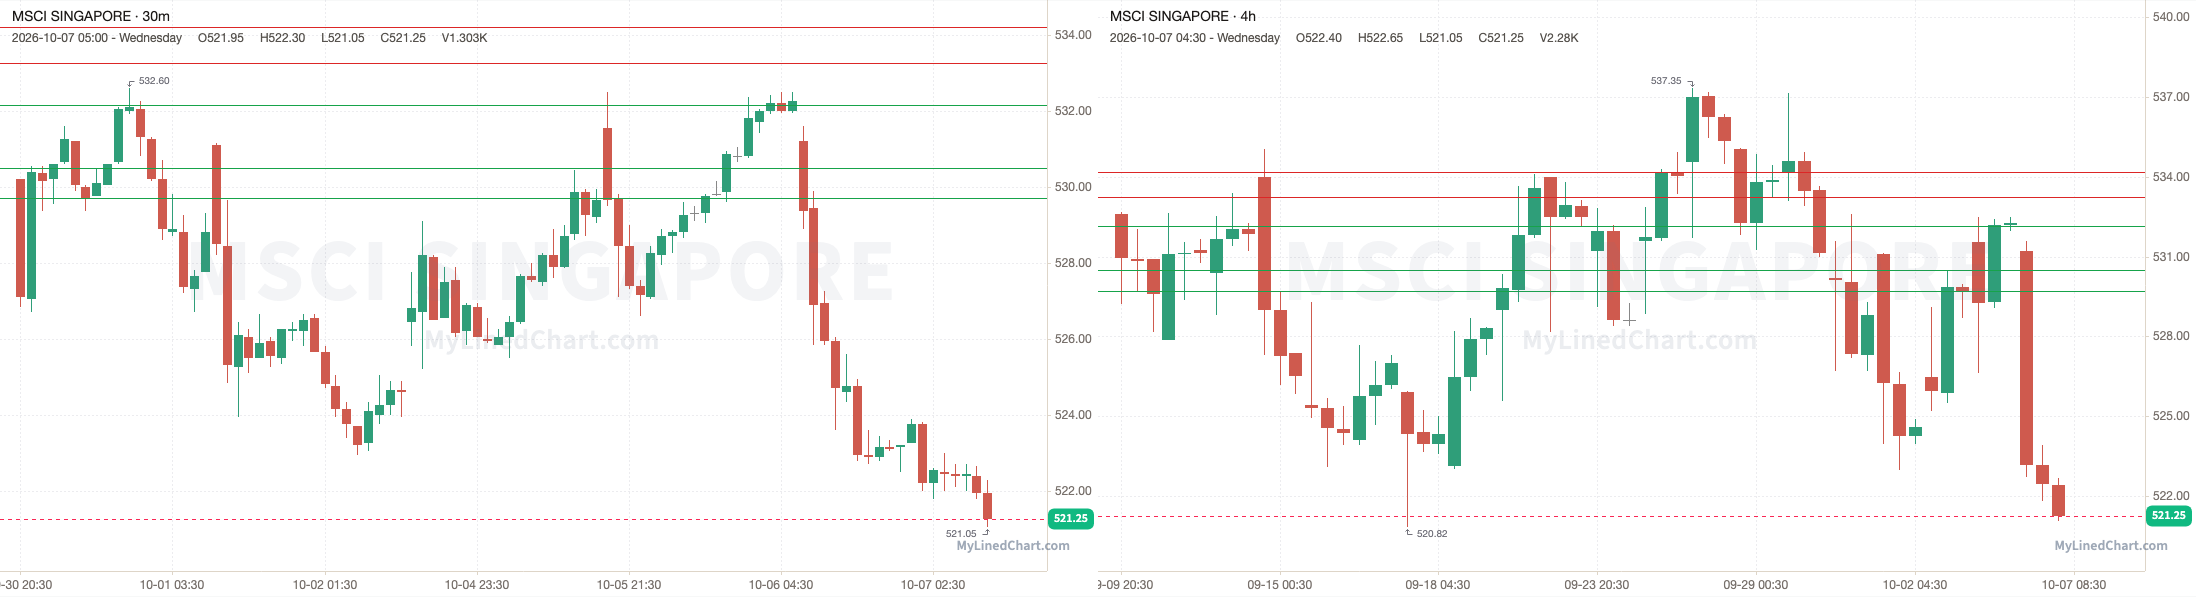
MSCI Singapore opened at 531.20, stayed under the 532.15 pivot and ran through every support level down to 529.70, and kept going to a low of 521.05, then ended up closing at 521.25. Finishing the trading session down 1.87% intraday.
October 7th session levels:
All listed levels: 529.70, 530.50, 532.15, 533.25, 534.20
Resistance above: 533.25, 534.20
Support below: 532.15, 530.50, 529.70
Nearest pivot: 532.15
Above 533.25 → 534.20 next
Lose 532.15 → 530.50 next
See the MSCI Singapore trade plan on Little Bird Trading
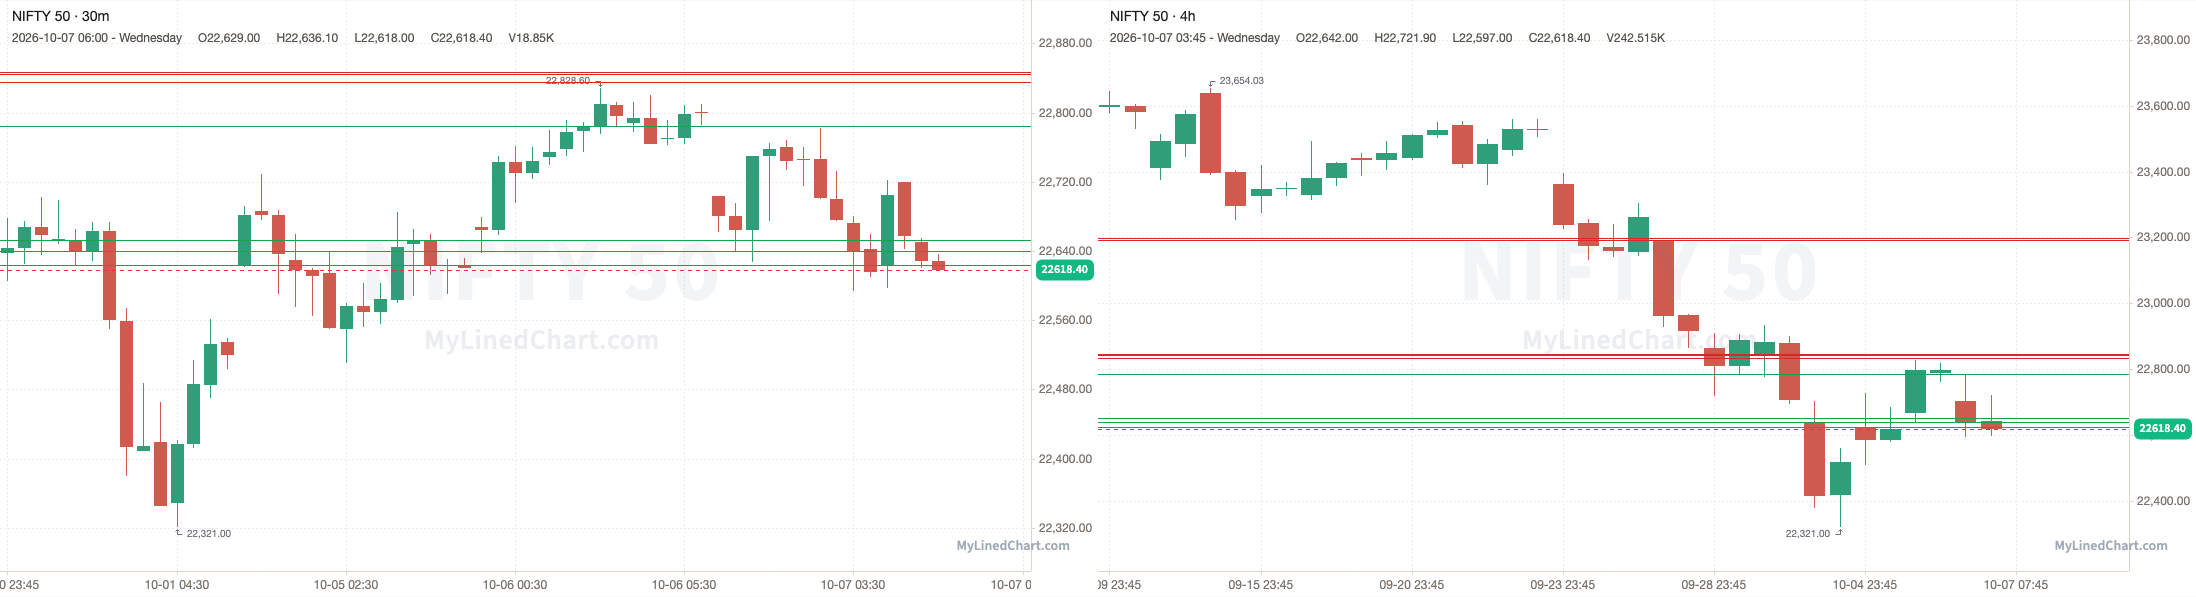
India: NIFTY 50
A recap of how the October 7th NIFTY 50 trading session and levels played out
NIFTY opened at 22703.10, stayed under the 22784.90 pivot and ran through every support level down to 22623.90, and kept going to a low of 22593.70, then ended up closing at 22618.40. Finishing the trading session down 0.37% intraday and down 0.79% overall.
October 7th session levels:
All listed levels: 22623.90, 22640, 22652.60, 22784.90, 22835, 22844.10, 22847, 23192.60, 23198.80
Resistance above: 22835, 22844.10, 22847, 23192.60, 23198.80
Support below: 22784.90, 22652.60, 22640, 22623.90
Nearest pivot: 22784.90
Above 22835 → 22844.10 next
Lose 22784.90 → 22652.60 next
See the NIFTY 50 trade plan on Little Bird Trading
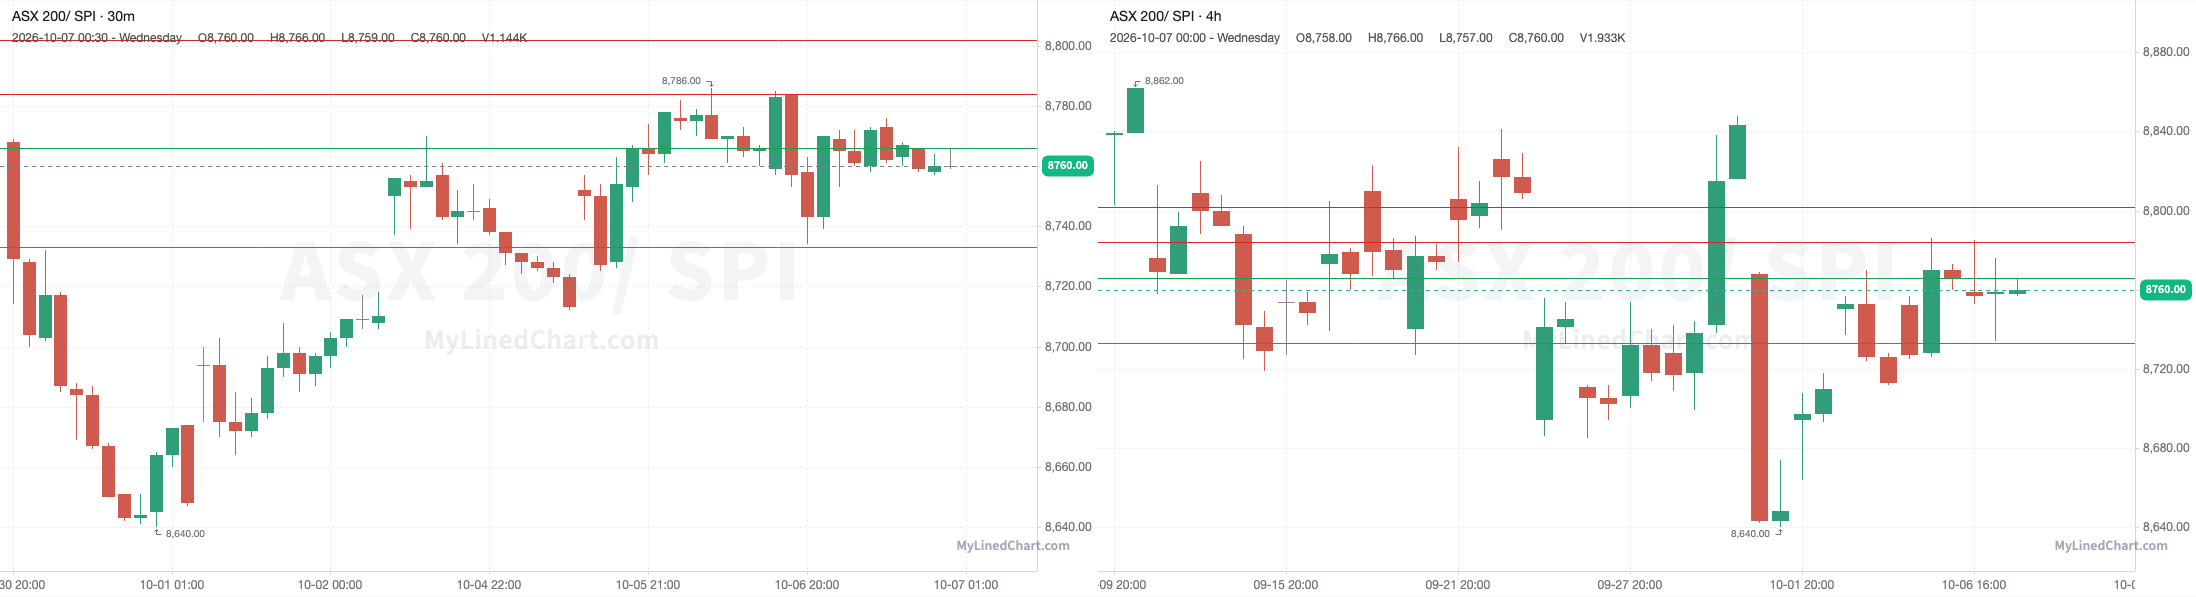
Australia: SPI
A recap of how the October 7th SPI trading session and levels played out
SPI opened at 8759, broke above the 8784 pivot and pushed to a high of 8785, then ended up closing at 8760. Finishing the trading session up 0.01% intraday and down 0.07% overall.
October 7th session levels:
All listed levels: 8733, 8766, 8784, 8802
Resistance above: 8784, 8802
Support below: 8766, 8733
Nearest pivot: 8784
Above 8784 → 8802 next
Lose 8766 → 8733 next
See the SPI trade plan on Little Bird Trading
Europe
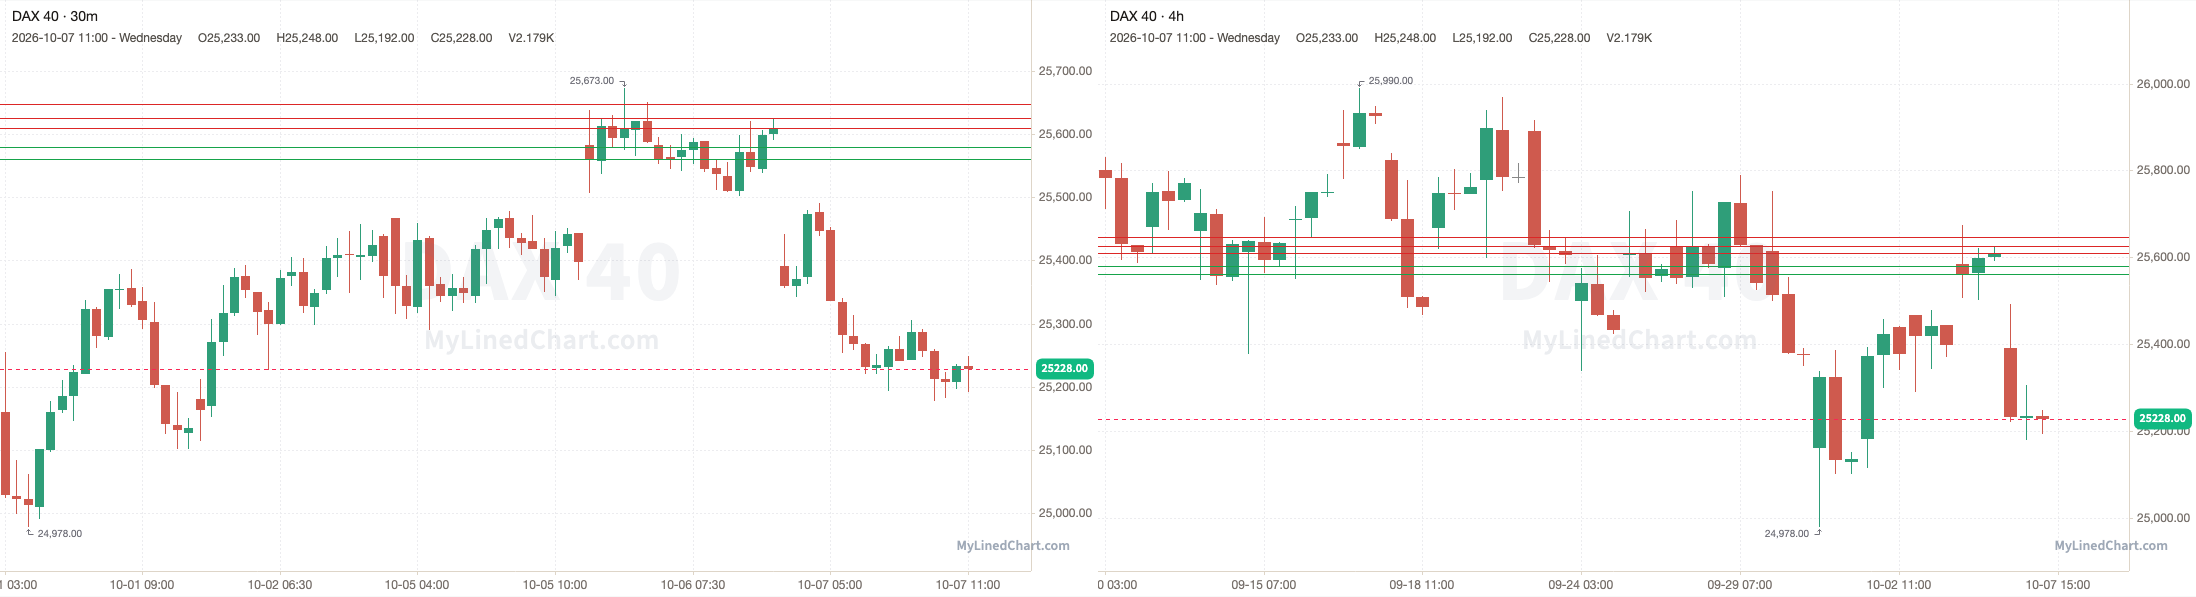
Germany: DAX 40
A recap of how the October 7th DAX 40 trading session and levels played out
DAX 40 opened at 25391, under the 25609 pivot and every level in the plan, and never traded back up to them, with a high of 25491 and a low of 25178, then ended up closing at 25228. Finishing the trading session down 0.64% intraday.
October 7th session levels:
All listed levels: 25560, 25579, 25609, 25625, 25647
Resistance above: 25625, 25647
Support below: 25579, 25560
Nearest pivot: 25609
Above 25625 → 25647 next
Lose 25579 → 25560 next
See the DAX 40 trade plan on Little Bird Trading
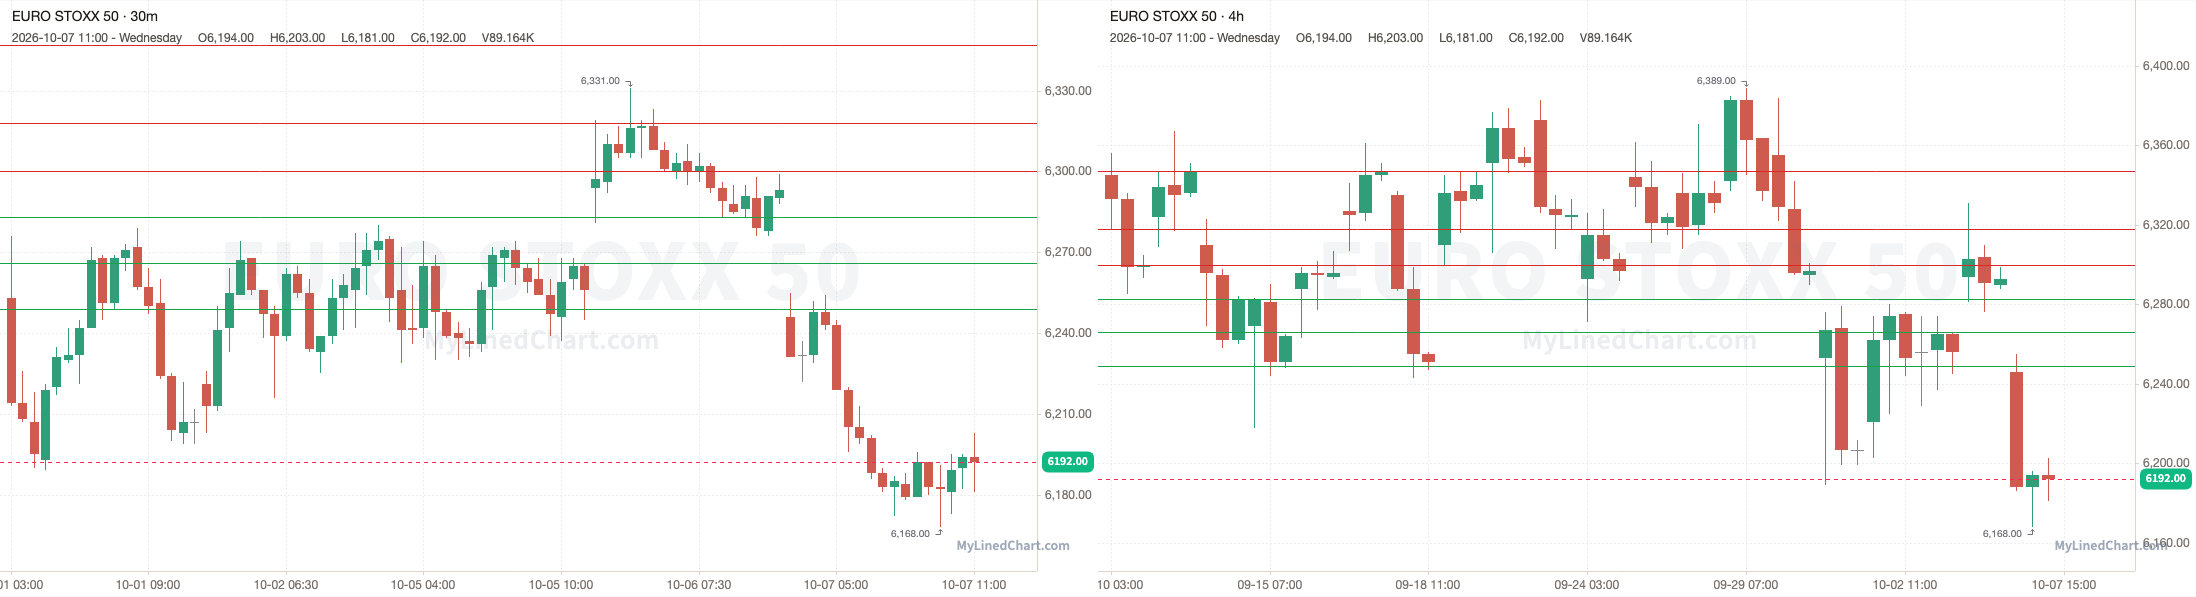
Eurozone: Euro Stoxx 50
A recap of how the October 7th Euro Stoxx 50 trading session and levels played out
Euro Stoxx 50 opened at 6246, stayed under the 6300 pivot and dropped to a low of 6168, then ended up closing at 6192. Finishing the trading session down 0.86% intraday.
October 7th session levels:
All listed levels: 6249, 6266, 6283, 6300, 6318, 6347
Resistance above: 6300, 6318, 6347
Support below: 6283, 6266, 6249
Nearest pivot: 6300
Above 6300 → 6318 next
Lose 6283 → 6266 next
See the Euro Stoxx 50 trade plan on Little Bird Trading
UK: FTSE 100
A recap of how the October 7th FTSE 100 trading session and levels played out
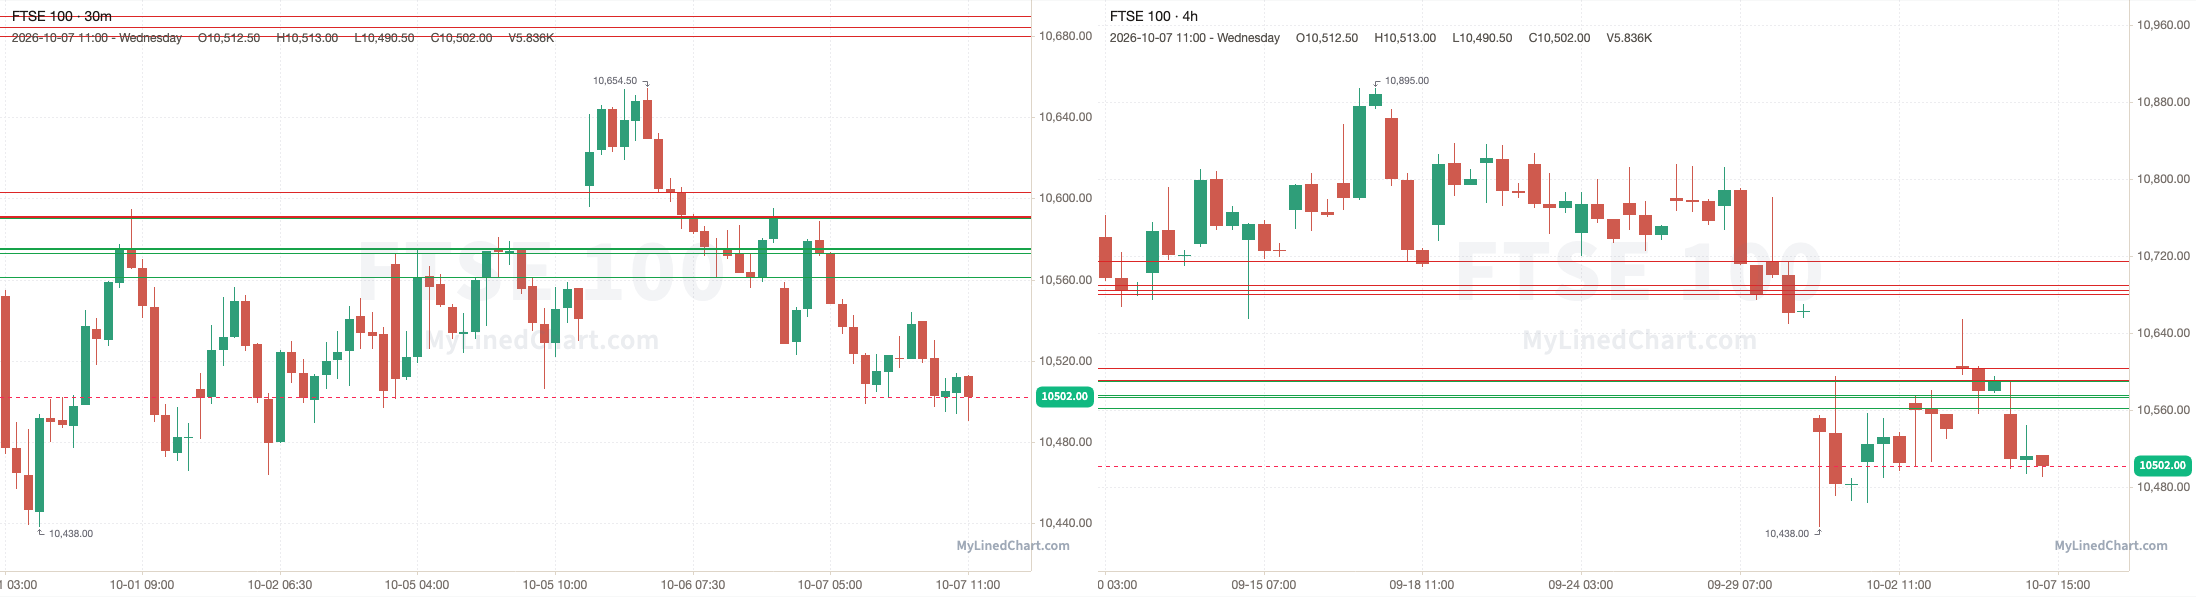
FTSE 100 opened at 10556, stayed under the 10591 pivot and dropped to a low of 10490.50, then ended up closing at 10502. Finishing the trading session down 0.51% intraday.
October 7th session levels:
All listed levels: 10561.50, 10573, 10575, 10575.50, 10590.50, 10590.57, 10591, 10591.50, 10603, 10680.05, 10684.58, 10690, 10714.50
Resistance above: 10591.50, 10603, 10680.05, 10684.58, 10690, 10714.50
Support below: 10590.57, 10590.50, 10575.50, 10575, 10573, 10561.50
Nearest pivot: 10591
Above 10591.50 → 10603 next
Lose 10590.57 → 10590.50 next
See the FTSE 100 trade plan on Little Bird Trading
France: CAC 40
A recap of how the October 7th CAC 40 trading session and levels played out
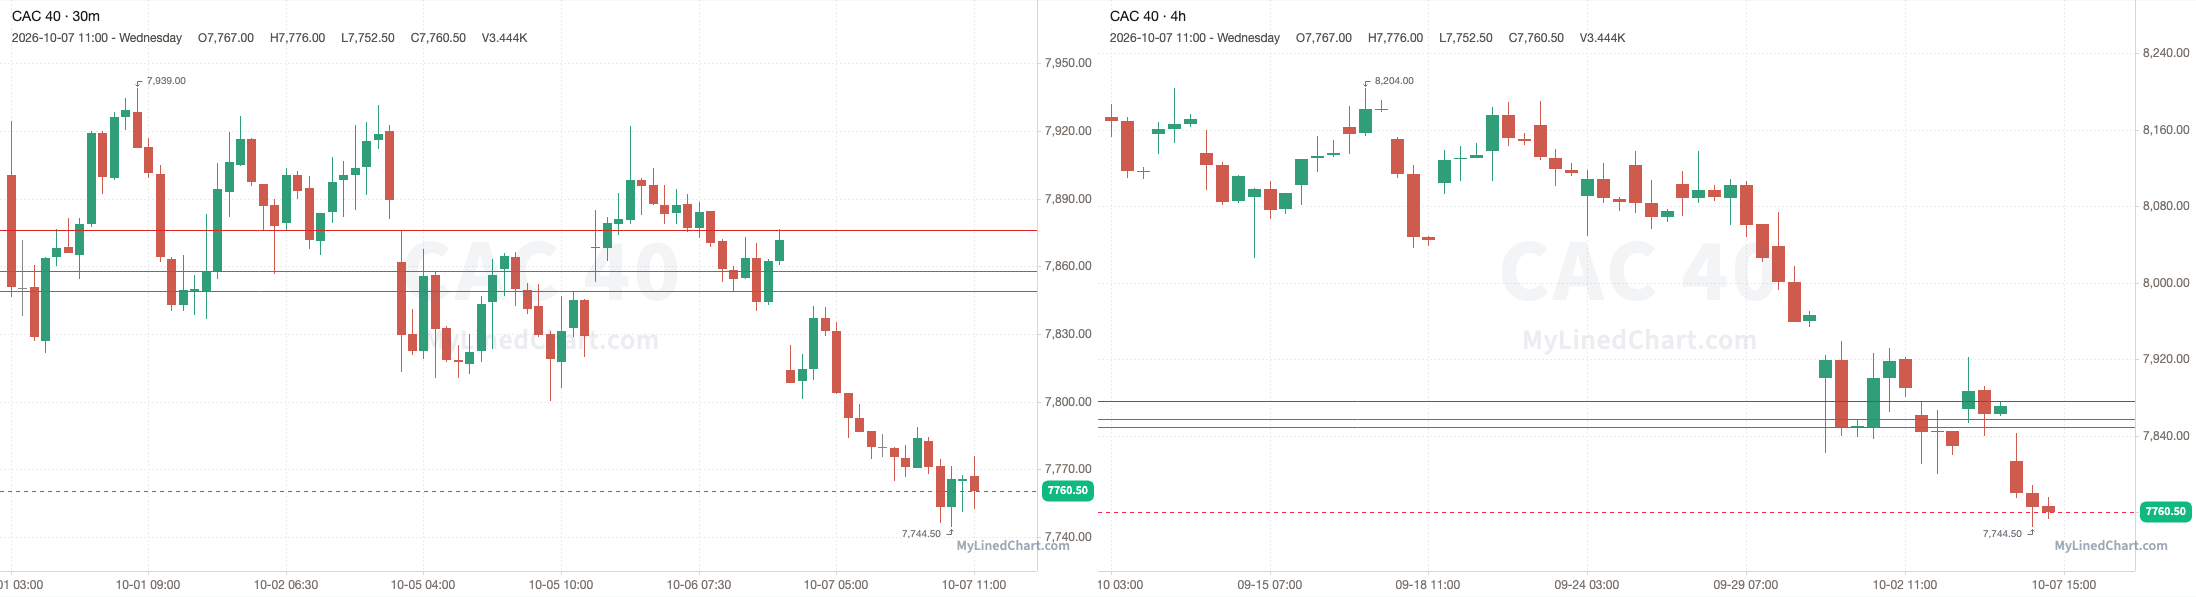
CAC 40 opened at 7814, under the 7876 pivot and every level in the plan, and never traded back up to them, with a high of 7842.50 and a low of 7744.50, then ended up closing at 7760.50. Finishing the trading session down 0.68% intraday.
October 7th session levels:
All listed levels: 7849, 7858, 7876
Resistance above: 7876
Support below: 7858, 7849
Nearest pivot: 7876
Above 7876 → open air
Lose 7858 → 7849 next
See the CAC 40 trade plan on Little Bird Trading
Spain: IBEX 35
A recap of how the October 7th IBEX 35 trading session and levels played out
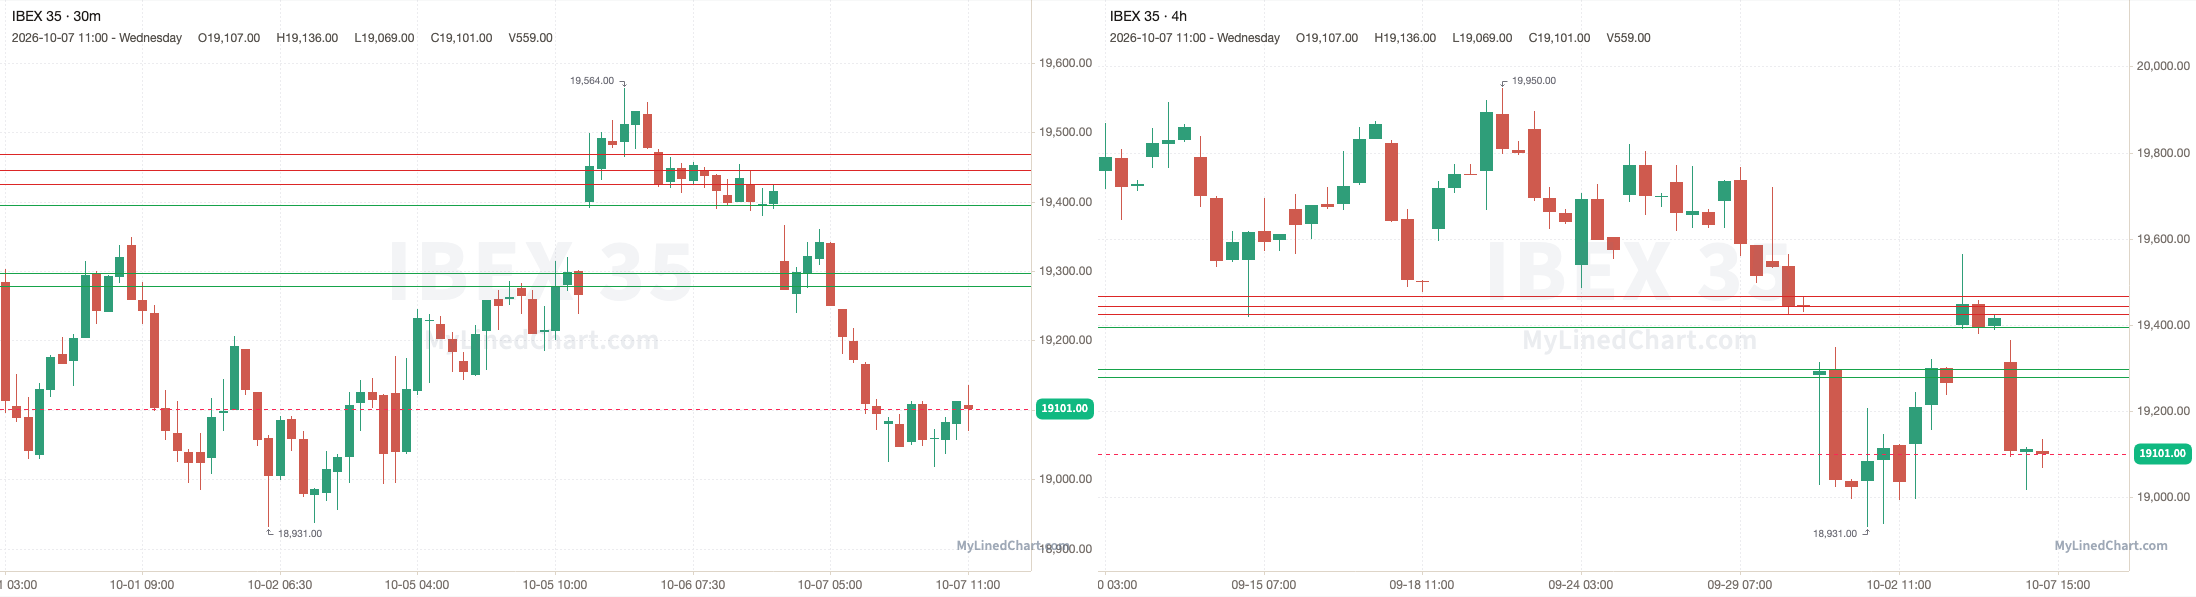
IBEX 35 opened at 19315, stayed under the 19426 pivot and dropped to tag 19279, with a low of 19018, then ended up closing at 19101. Finishing the trading session down 1.11% intraday.
October 7th session levels:
All listed levels: 19279, 19297, 19395, 19426, 19445, 19468
Resistance above: 19426, 19445, 19468
Support below: 19395, 19297, 19279
Nearest pivot: 19426
Above 19426 → 19445 next
Lose 19395 → 19297 next
See the IBEX 35 trade plan on Little Bird Trading
Italy: FTSE MIB
A recap of how the October 7th FTSE MIB trading session and levels played out
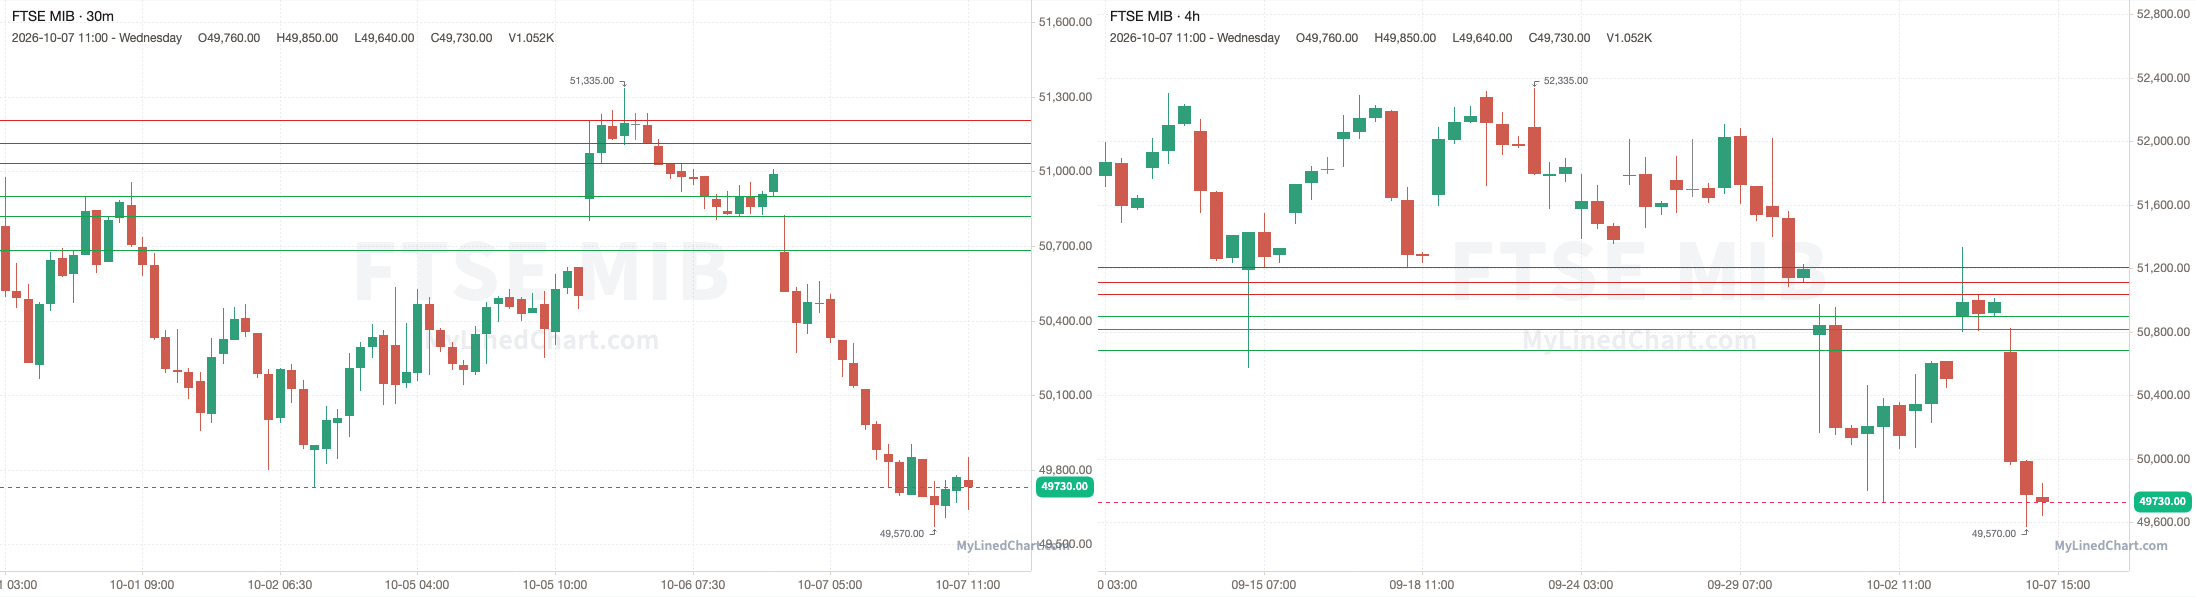
FTSE MIB opened at 50675, stayed under the 51035 pivot and dropped to a low of 49570, then ended up closing at 49730. Finishing the trading session down 1.86% intraday.
October 7th session levels:
All listed levels: 50685, 50820, 50900, 51035, 51115, 51205
Resistance above: 51035, 51115, 51205
Support below: 50900, 50820, 50685
Nearest pivot: 51035
Above 51035 → 51115 next
Lose 50900 → 50820 next
See the FTSE MIB trade plan on Little Bird Trading
Netherlands: AEX
A recap of how the October 7th AEX trading session and levels played out
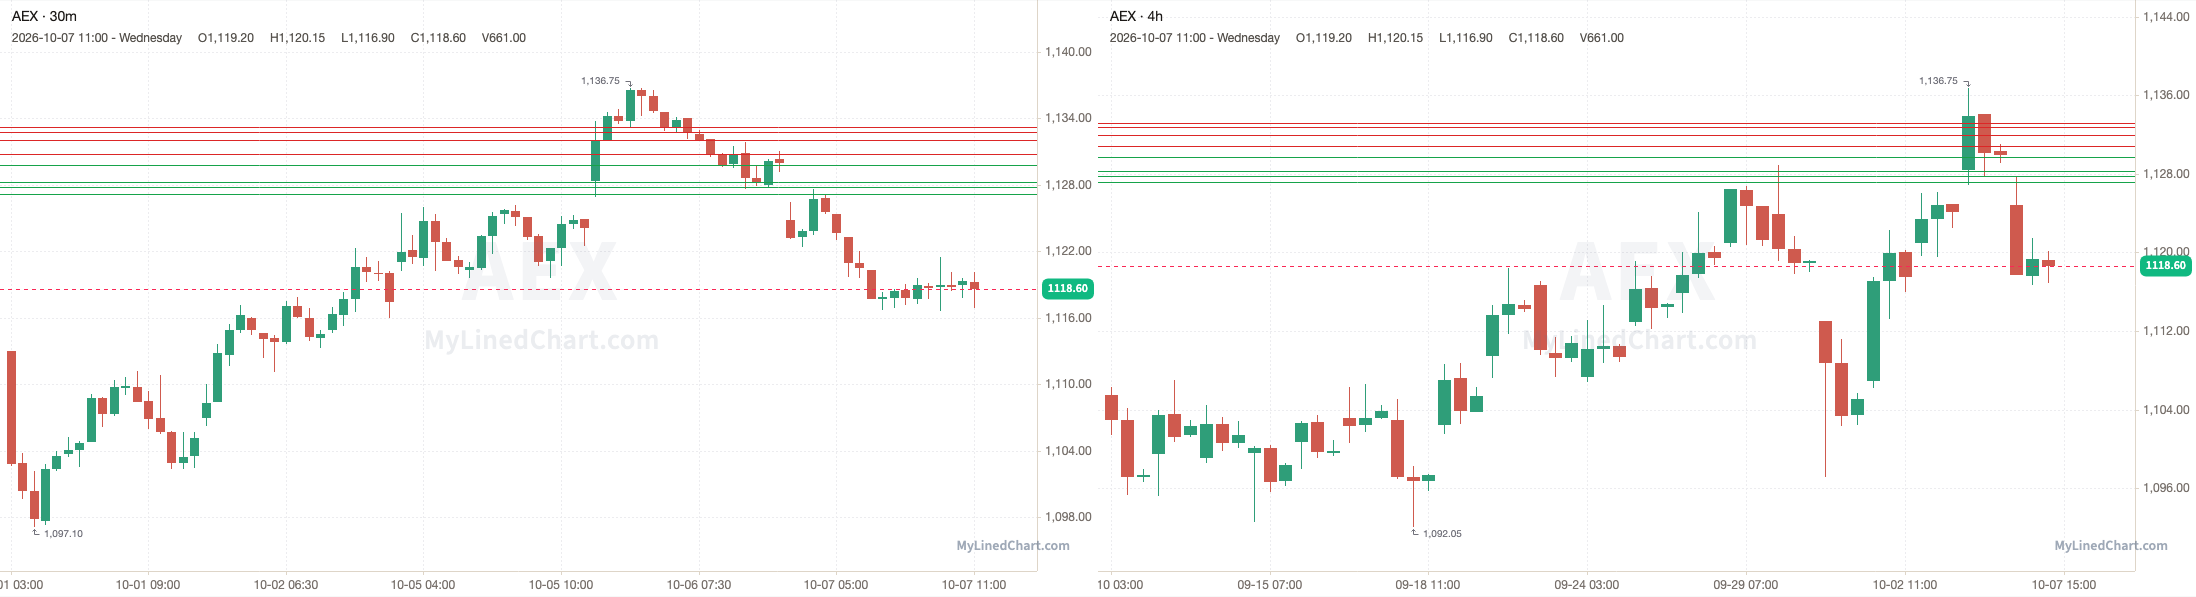
AEX opened at 1124.85, stayed under the 1129.75 pivot and dropped to a low of 1116.65, then ended up closing at 1118.60. Finishing the trading session down 0.56% intraday.
October 7th session levels:
All listed levels: 1127.20, 1127.80, 1128.25, 1129.75, 1130.80, 1132, 1132.75, 1133.20
Resistance above: 1130.80, 1132, 1132.75, 1133.20
Support below: 1129.75, 1128.25, 1127.80, 1127.20
Nearest pivot: 1129.75
Above 1130.80 → 1132 next
Lose 1129.75 → 1128.25 next
See the AEX trade plan on Little Bird Trading
Sweden: OMXS30
A recap of how the October 7th OMXS30 trading session and levels played out
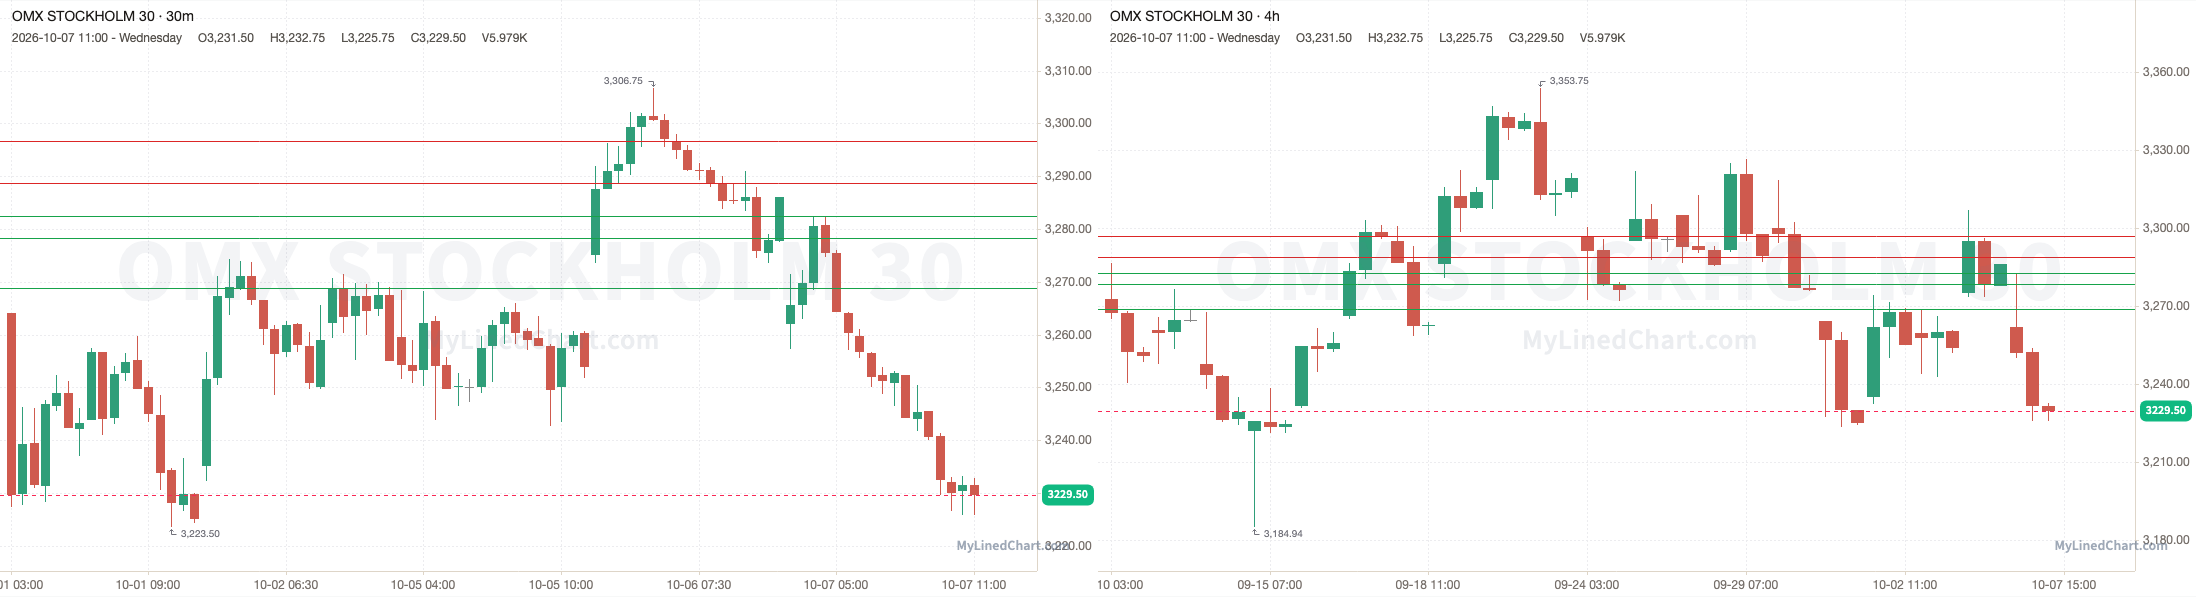
OMXS30 opened at 3262, stayed under the 3288.75 pivot and dropped to a low of 3225.75, then ended up closing at 3229.50. Finishing the trading session down 1.00% intraday.
October 7th session levels:
All listed levels: 3268.75, 3278.25, 3282.50, 3288.75, 3296.75
Resistance above: 3288.75, 3296.75
Support below: 3282.50, 3278.25, 3268.75
Nearest pivot: 3288.75
Above 3288.75 → 3296.75 next
Lose 3282.50 → 3278.25 next
See the OMXS30 trade plan on Little Bird Trading
Switzerland: SMI
A recap of how the October 7th SMI trading session and levels played out
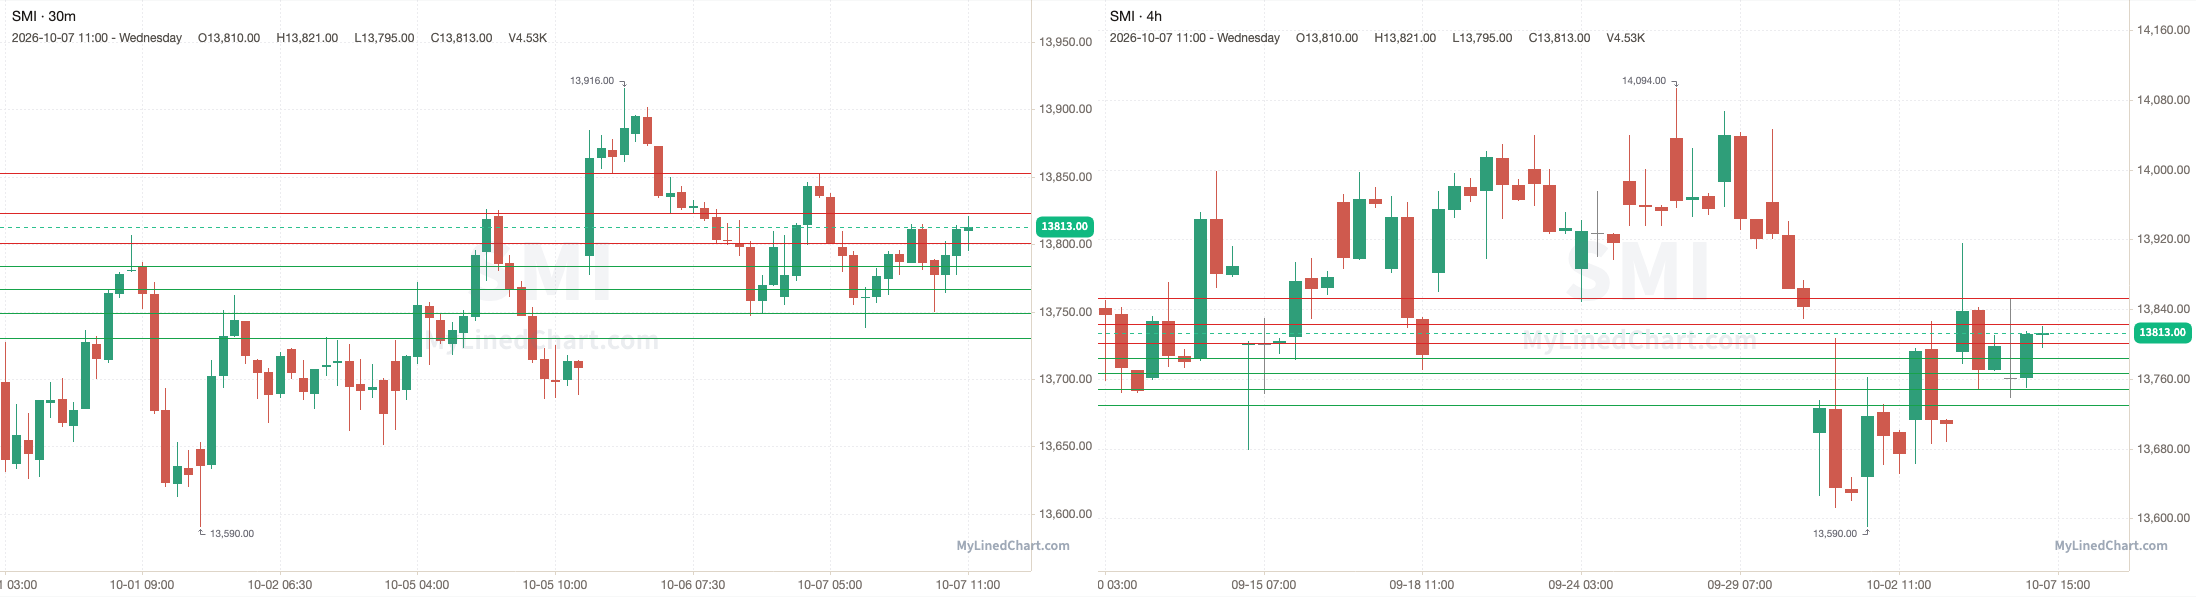
SMI opened at 13761, broke above the 13801 pivot and ran through every resistance level up to 13853, then ended up closing at 13813. Finishing the trading session up 0.38% intraday.
October 7th session levels:
All listed levels: 13730, 13749, 13767, 13784, 13801, 13823, 13853
Resistance above: 13801, 13823, 13853
Support below: 13784, 13767, 13749, 13730
Nearest pivot: 13801
Above 13801 → 13823 next
Lose 13784 → 13767 next
See the SMI trade plan on Little Bird Trading
Latin America
Mexico: S&P/BMV IPC
No S&P/BMV IPC review available today.
See the S&P/BMV IPC trade plan on Little Bird Trading
Brazil: Ibovespa
No Ibovespa review available today.
See the Ibovespa trade plan on Little Bird Trading
Get each market's levels in real time as they're posted. Sign up on Little Bird Trading.
Pro: next-session levels for the markets you trade, on Little Bird Trading.
Disclaimer: Little Bird Trading and any of its associations may or may not, whether long or short, have a position in any instruments. Not investment advice. Provided for informational purposes only. Not a recommendation or endorsement. Not registered or licensed. Model portfolios are property of their respective owners. All data is sourced from publicly available information. No guarantee is being made or offered. Not responsible for financial loss or ruin. Little Bird Trading may earn a commission if you purchase through links on the site.
Day Trade Levels for the October 8th Trading Session:
Enjoying this content?
Subscribe on Substack