

SPY, DAX +18 Global Market Levels: Oct 5th Trade Plan Plus Charts
Support, resistance and pivot levels for SPY, ES, QQQ, NQ and 19 stock markets across Asia, Europe and the Americas ahead of the October 5th session, plus how the last session's levels traded.
MyLinedChart works however you get to a trade: AI-Assisted, Discretionary, Quant, or Macro. Export your lines, levels plus the whole chart as XLSX, JSON, or CSV. Or, let AI do all the work for you.
Here’s an overview of how MyLinedChart compares to Trading View and TrendSpider. Available on Windows, Apple and Android.
Looking for a pro to build your trading workflows? Reach out on Upwork.
Get each market's levels in real time as they're posted. Sign up on Little Bird Trading.
US
A recap of how the October 2nd trading session and levels played out
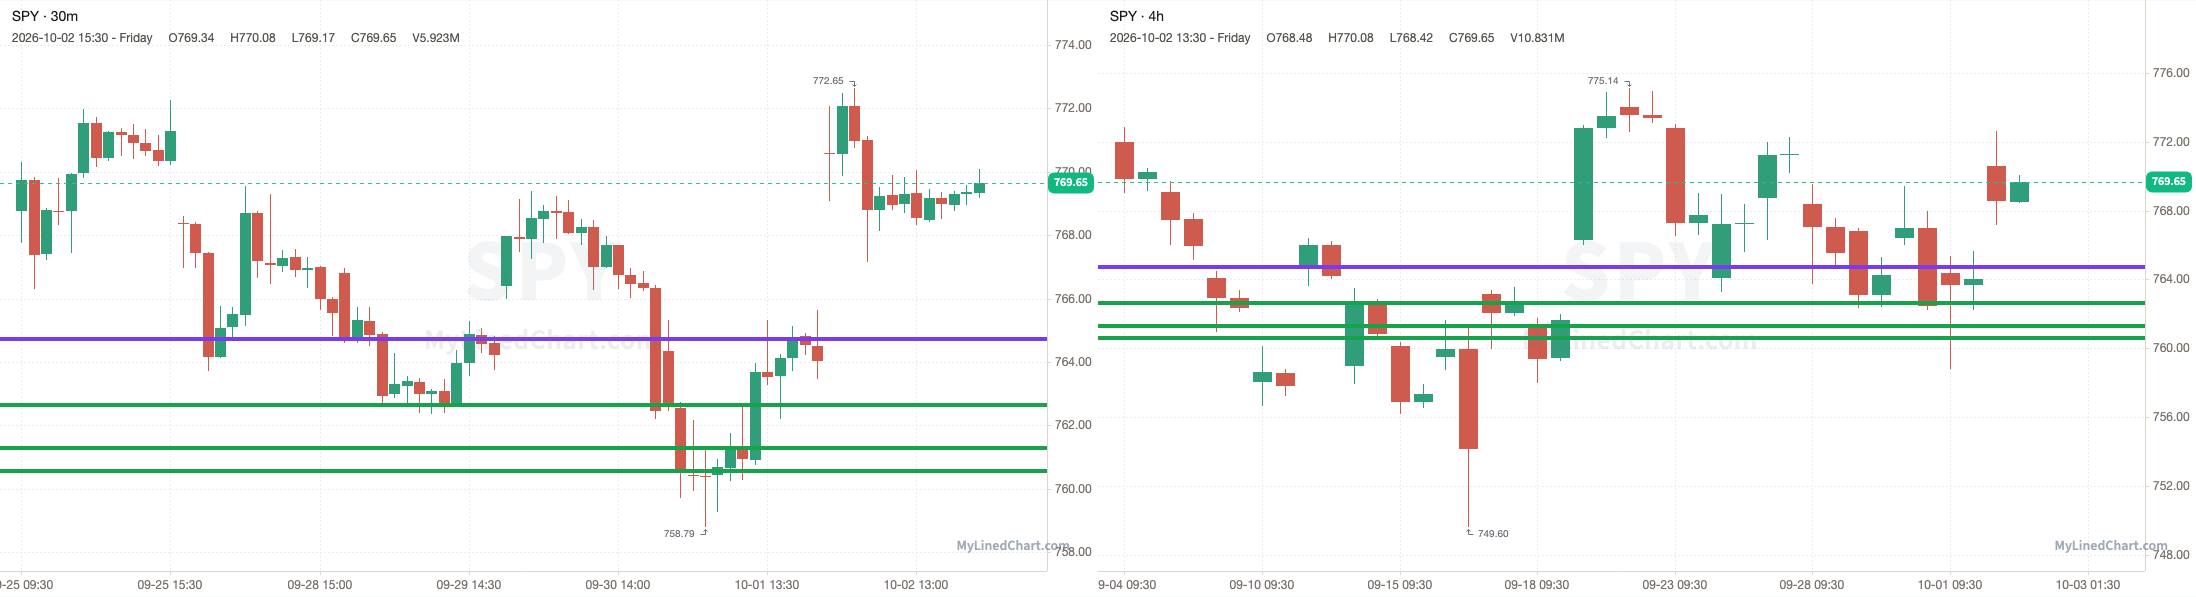
SPY opened at 770.58, held above the 760.57 to 764.74 zone, with a final close of 769.65. SPY finished down 0.12% intraday and up 0.74% overall.
October 2nd session levels:
All listed levels: 760.57, 761.30, 762.65, 764.74
Resistance above: 764.74
Support below: 762.65, 761.30, 760.57
Nearest pivot: 764.74
Above 764.74 → open air
Lose 762.65 → 761.30 next
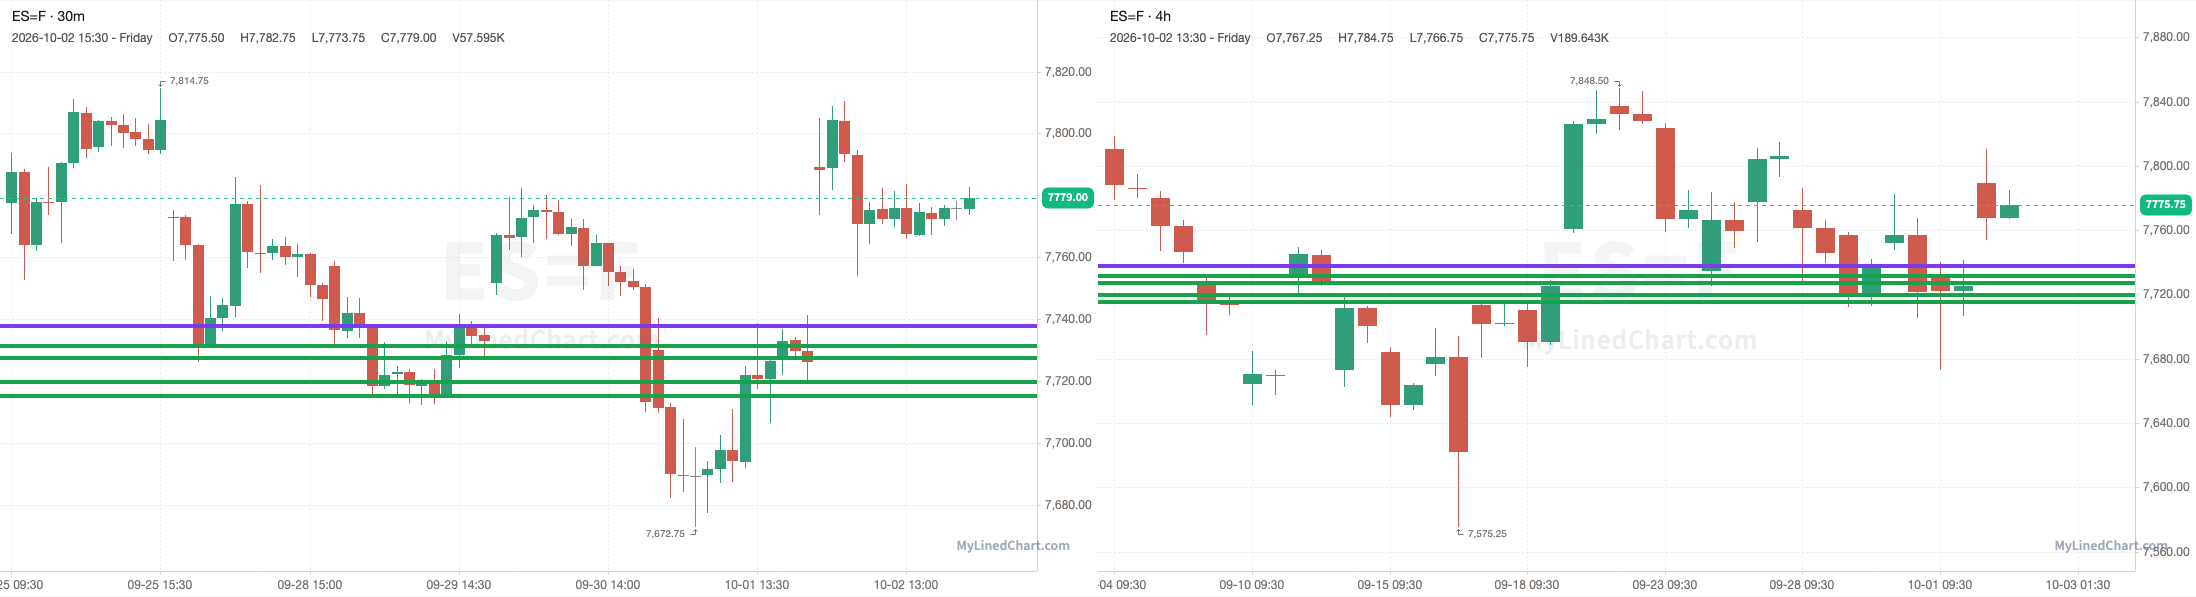
ES opened at 7789.25, held above the 7715 to 7737.75 zone, with a final close of 7775.75. ES finished down 0.17% intraday and up 0.66% overall.
October 2nd session levels:
All listed levels: 7715, 7719.50, 7727.25, 7731.25, 7737.75
Resistance above: 7727.25, 7731.25, 7737.75
Support below: 7719.50, 7715
Nearest pivot: 7727.25
Above 7727.25 → 7731.25 next
Lose 7719.50 → 7715 next
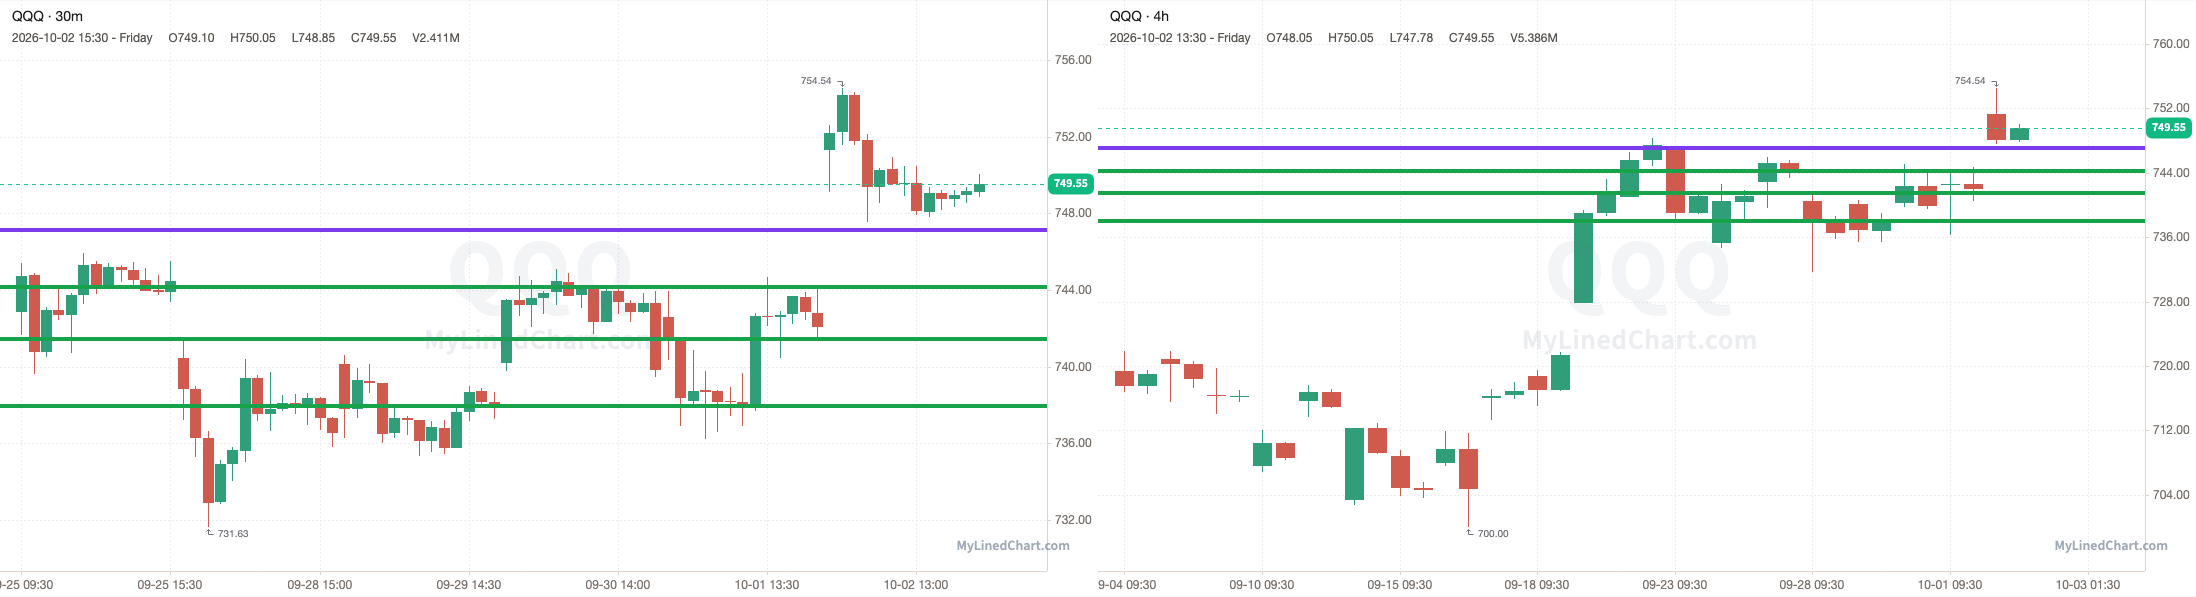
QQQ opened at 751.31, held above the 737.95 to 747.11 zone, with a final close of 749.55. QQQ finished down 0.23% intraday and up 1.01% overall.
October 2nd session levels:
All listed levels: 737.95, 741.44, 744.17, 747.11
Resistance above: 744.17, 747.11
Support below: 741.44, 737.95
Nearest pivot: 741.44
Above 744.17 → 747.11 next
Lose 741.44 → 737.95 next
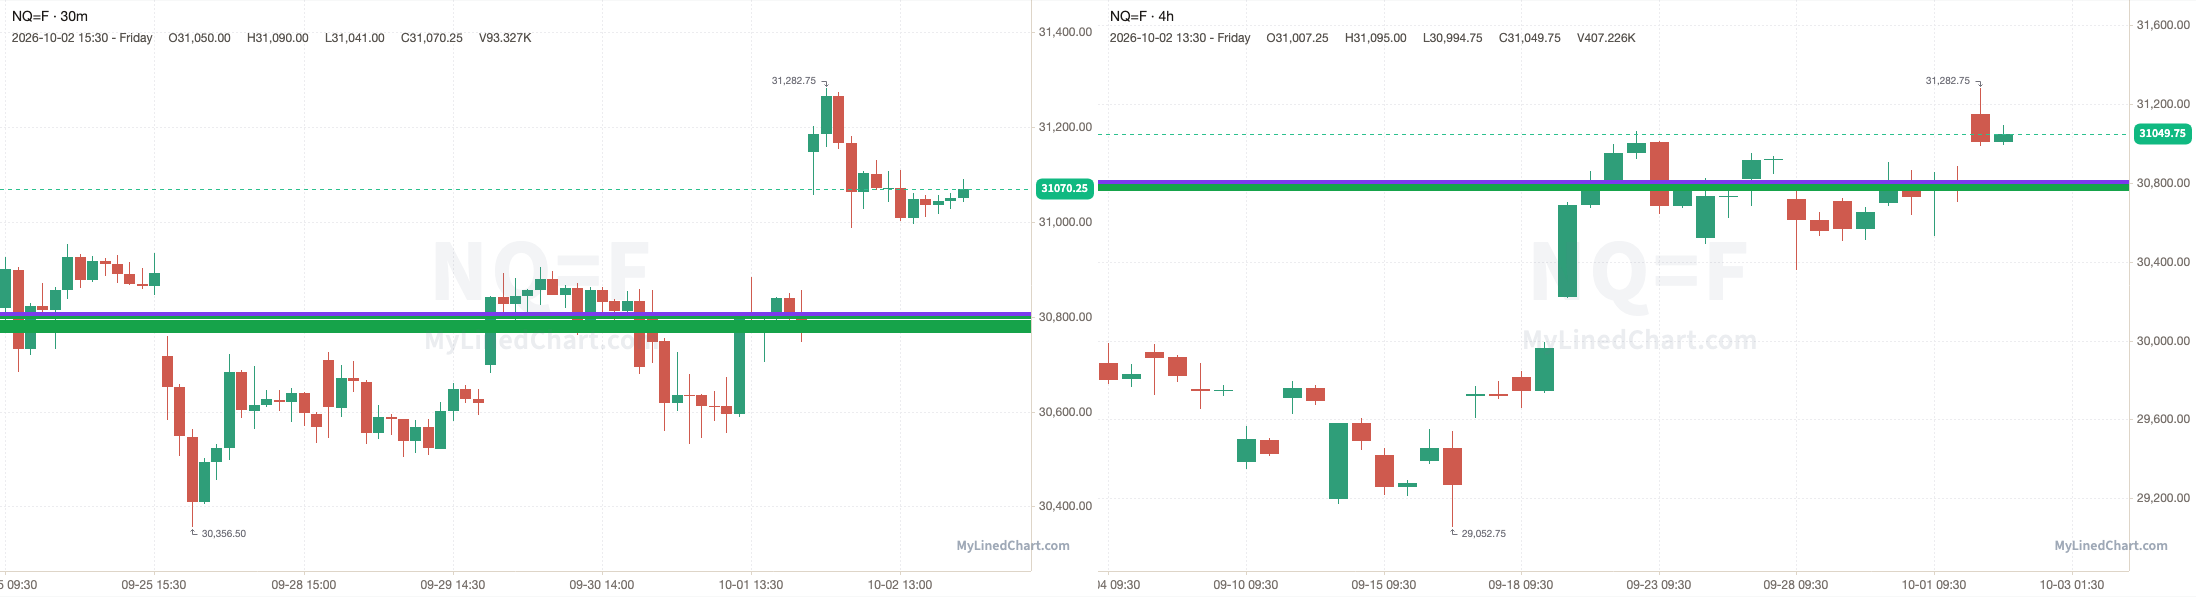
NQ opened at 31148, held above the 30769.50 to 30806.75 zone, with a final close of 31049.75. NQ finished down 0.32% intraday and up 0.91% overall.
October 2nd session levels:
All listed levels: 30769.50, 30774, 30779.50, 30783, 30786.50, 30789.50, 30799.75, 30806.75
Resistance above: 30774, 30779.50, 30783, 30786.50, 30789.50, 30799.75, 30806.75
Support below: 30769.50
Nearest pivot: 30769.50
Above 30774 → 30779.50 next
Lose 30769.50 → open air
See the SPY, ES, QQQ & NQ trade plan on Little Bird Trading
Asia
Japan: Nikkei 225
No Nikkei 225 review available today.
See the Nikkei 225 trade plan on Little Bird Trading
Korea: KOSPI 200
No KOSPI 200 review available today.
See the KOSPI 200 trade plan on Little Bird Trading
China: FTSE China A50
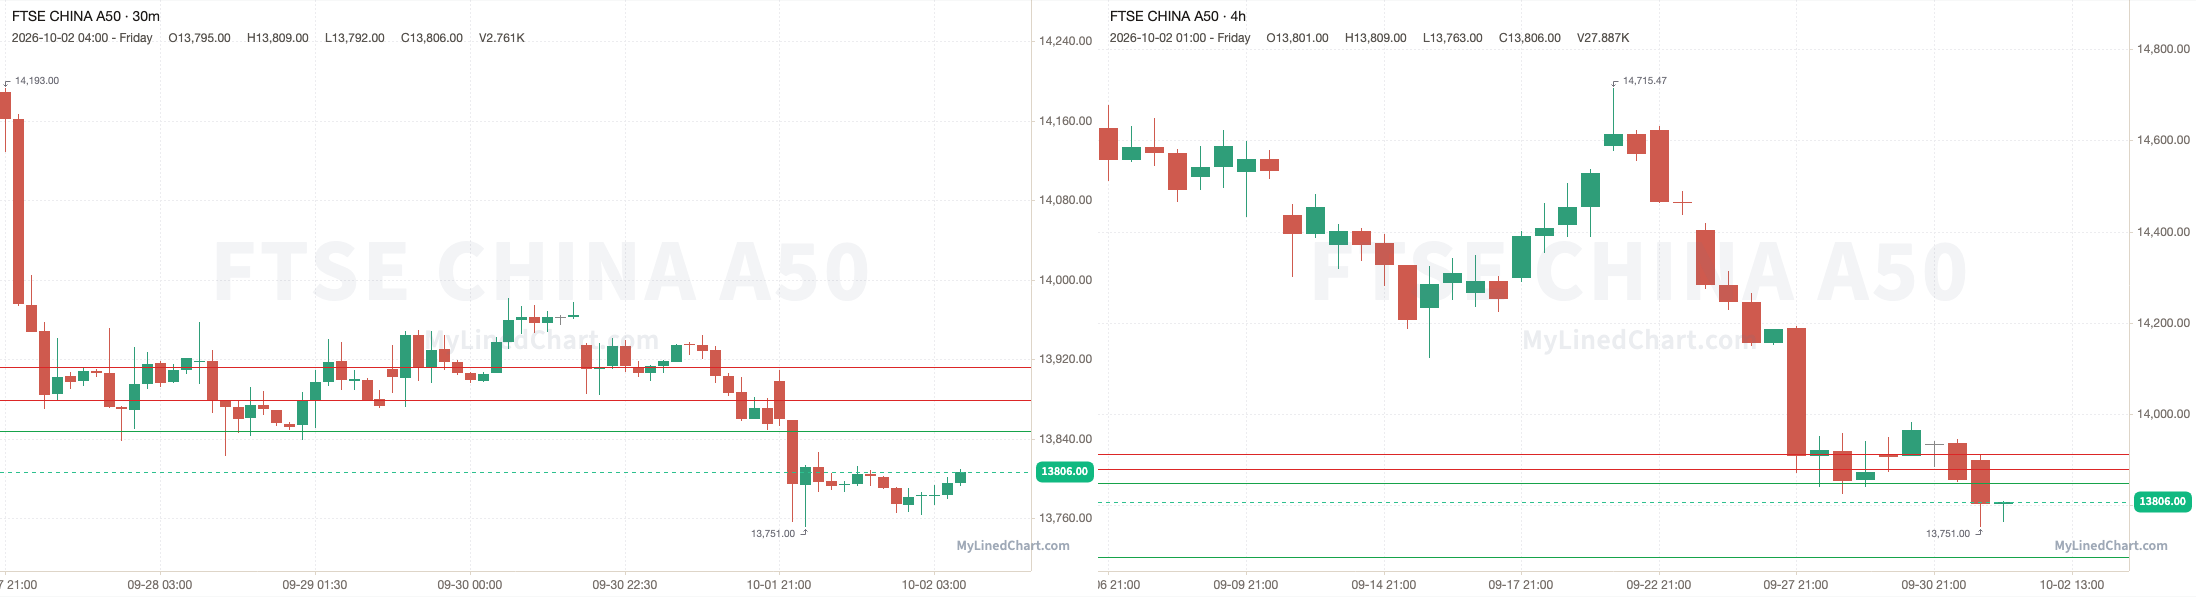
A recap of how the October 2nd FTSE China A50 trading session and levels played out
FTSE China A50 opened at 13898, dropped down and tagged the 13848 to 13879 zone and low at 13751, then ended up closing at 13806. Finishing the trading session down 0.66% intraday.
October 2nd session levels:
All listed levels: 13686, 13848, 13879, 13912
Resistance above: 13879, 13912
Support below: 13848, 13686
Nearest pivot: 13848
Above 13879 → 13912 next
Lose 13848 → 13686 next
See the FTSE China A50 trade plan on Little Bird Trading
Hong Kong: Hang Seng
No Hang Seng review available today.
See the Hang Seng trade plan on Little Bird Trading
Taiwan: FTSE Taiwan
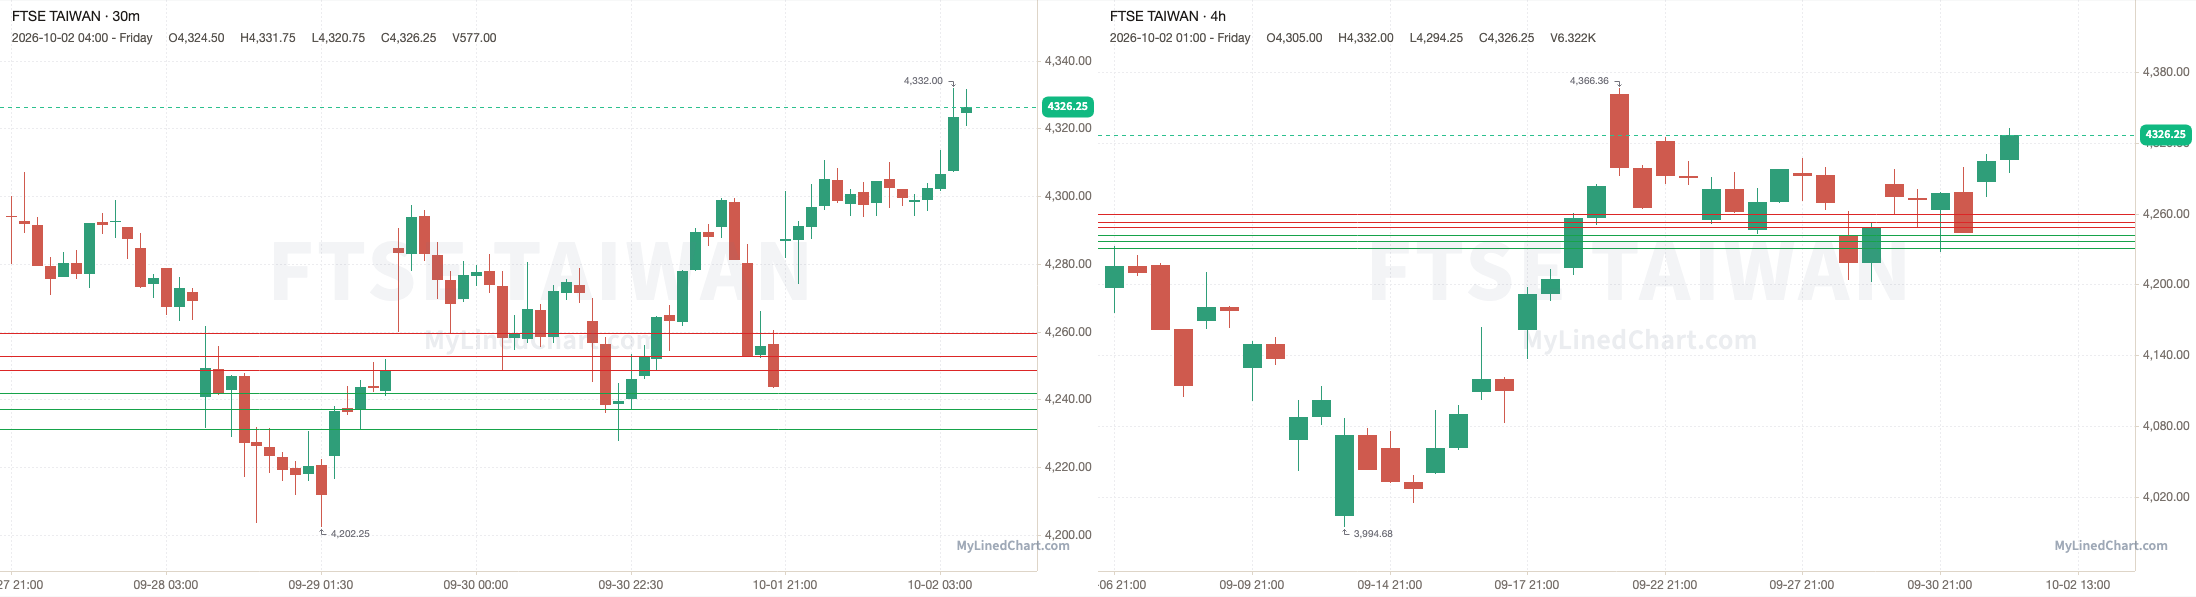
A recap of how the October 2nd FTSE Taiwan trading session and levels played out
FTSE Taiwan opened at 4286.75, stayed above every level, with a high of 4332 and a low of 4274, then ended up closing at 4326.25. Finishing the trading session up 0.92% intraday.
October 2nd session levels:
All listed levels: 4231.25, 4237, 4242, 4248.75, 4252.75, 4259.50
Resistance above: 4248.75, 4252.75, 4259.50
Support below: 4242, 4237, 4231.25
Nearest pivot: 4248.75
Above 4248.75 → 4252.75 next
Lose 4242 → 4237 next
See the FTSE Taiwan trade plan on Little Bird Trading
Singapore: MSCI Singapore
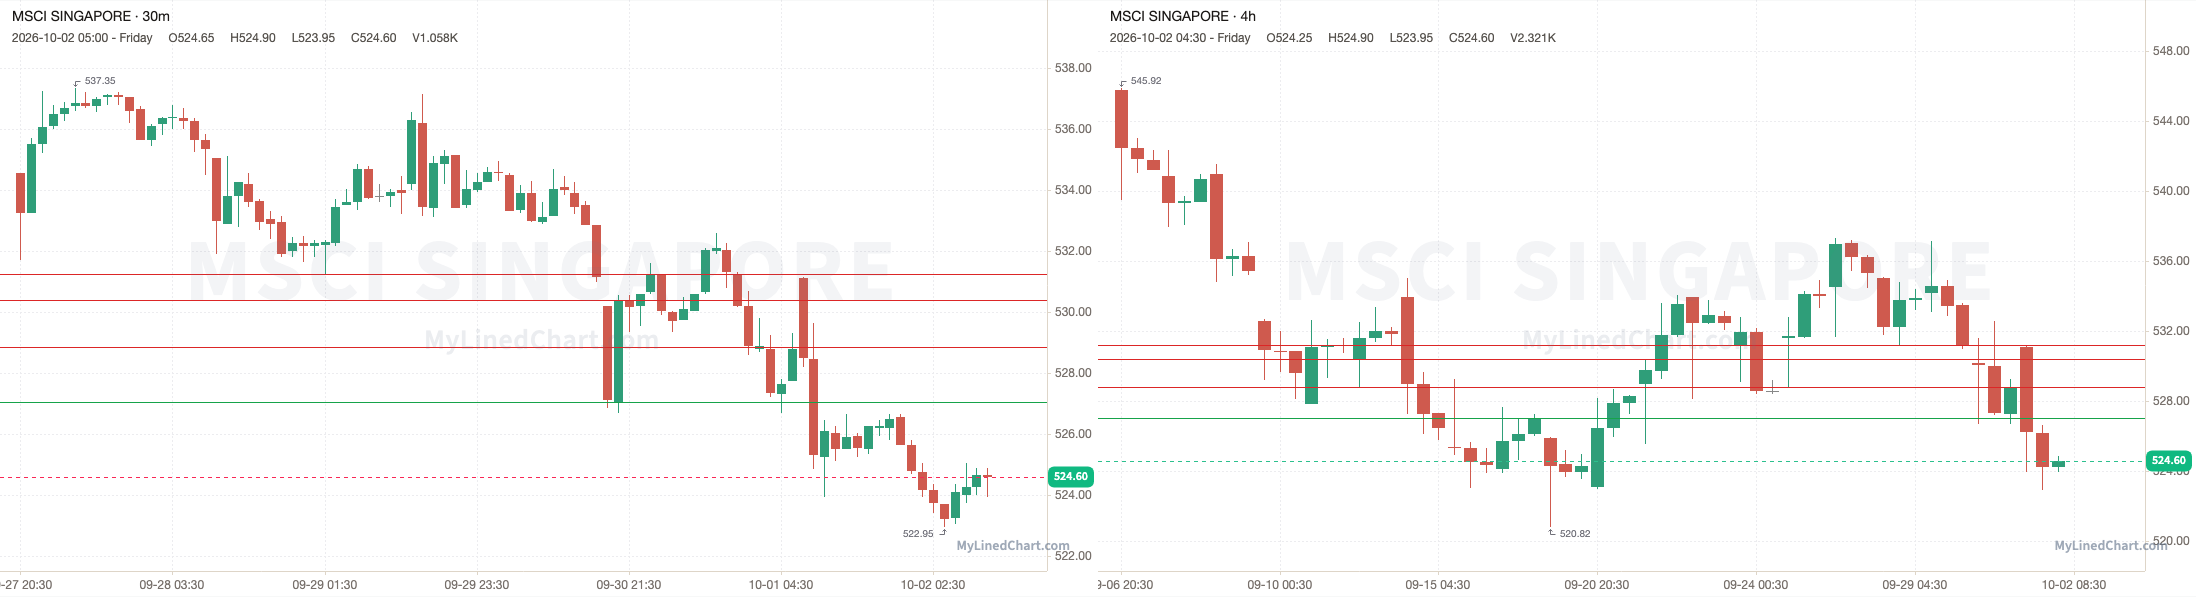
A recap of how the October 2nd MSCI Singapore trading session and levels played out
MSCI Singapore opened at 531.10, dropped down and tagged the 527.05 to 528.85 zone and low at 522.95, then ended up closing at 524.60. Finishing the trading session down 1.22% intraday.
October 2nd session levels:
All listed levels: 527.05, 528.85, 530.40, 531.25
Resistance above: 528.85, 530.40, 531.25
Support below: 527.05
Nearest pivot: 528.85
Above 528.85 → 530.40 next
Lose 527.05 → open air
See the MSCI Singapore trade plan on Little Bird Trading
India: NIFTY 50
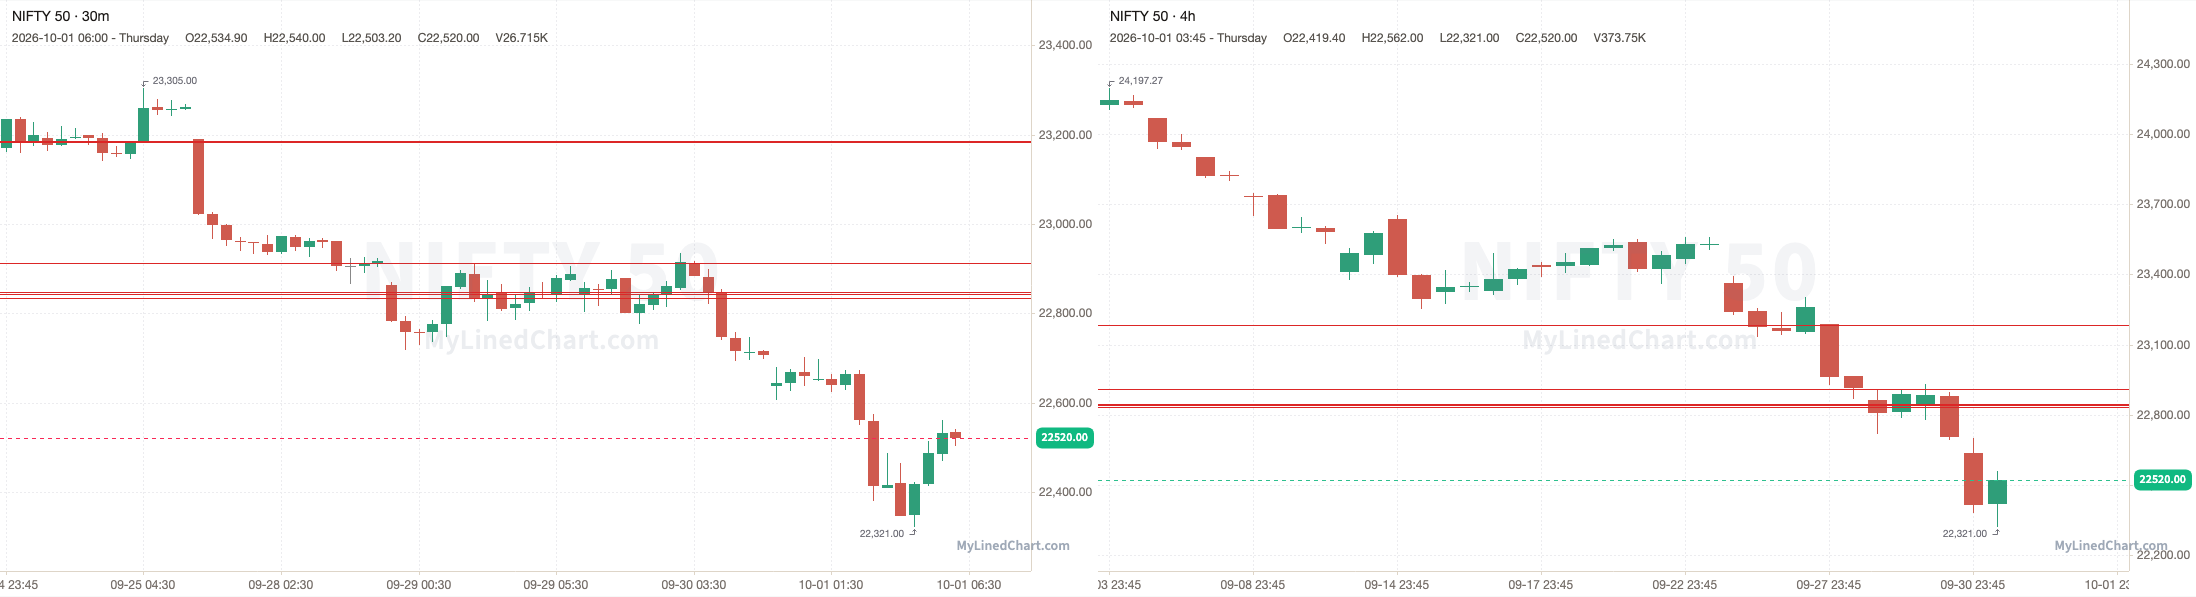
A recap of how the October 1st NIFTY 50 trading session and levels played out
NIFTY opened at 22638, stayed below every level, with a high of 22702.20 and a low of 22321, then ended up closing at 22520. Finishing the trading session down 0.52% intraday and down 0.82% overall.
October 1st session levels:
All listed levels: 22835, 22844.10, 22847, 22912.10, 23183.60, 23185.10
Resistance above: 22835, 22844.10, 22847, 22912.10, 23183.60, 23185.10
Support below: none
Nearest pivot: 22835
Above 22835 → 22844.10 next
See the NIFTY 50 trade plan on Little Bird Trading
Australia: SPI
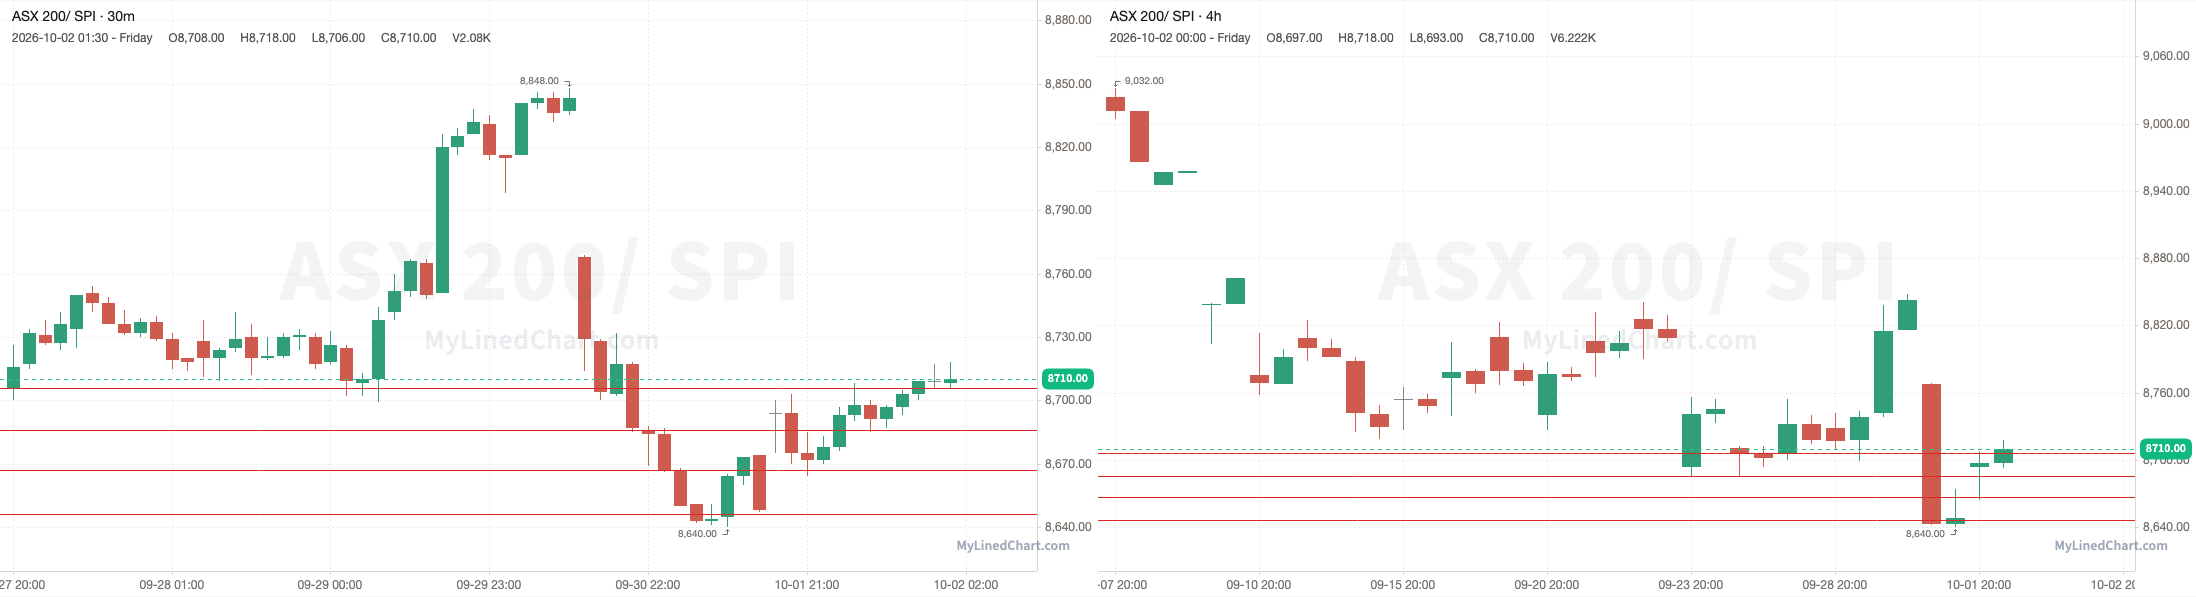
A recap of how the October 2nd SPI trading session and levels played out
SPI opened at 8694, ran up and tagged the 8686 to 8706 zone and high at 8718, then ended up closing at 8710. Finishing the trading session up 0.18% intraday and up 0.72% overall.
October 2nd session levels:
All listed levels: 8646, 8667, 8686, 8706
Resistance above: 8646, 8667, 8686, 8706
Support below: none
Nearest pivot: 8646
Above 8646 → 8667 next
See the SPI trade plan on Little Bird Trading
Europe
Germany: DAX 40
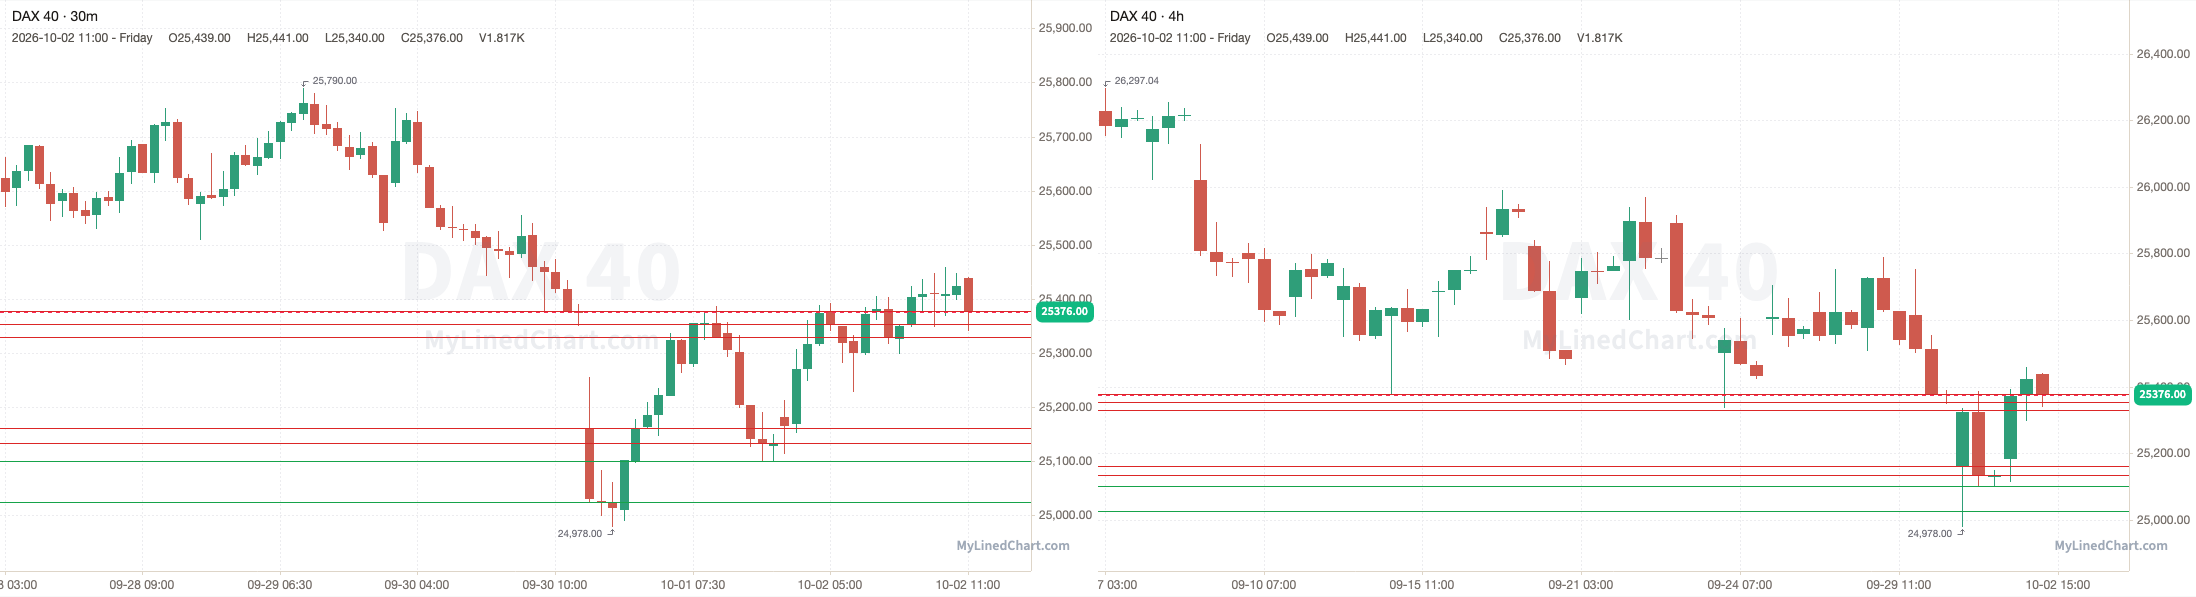
A recap of how the October 2nd DAX 40 trading session and levels played out
DAX 40 opened at 25181, ran up and tagged the 25354 to 25377 zone and high at 25458, then ended up closing at 25376. Finishing the trading session up 0.77% intraday.
October 2nd session levels:
All listed levels: 25025, 25100, 25134, 25161, 25329, 25354, 25377
Resistance above: 25161, 25329, 25354, 25377
Support below: 25100, 25025
Nearest pivot: 25134
Above 25161 → 25329 next
Lose 25100 → 25025 next
See the DAX 40 trade plan on Little Bird Trading
Eurozone: Euro Stoxx 50
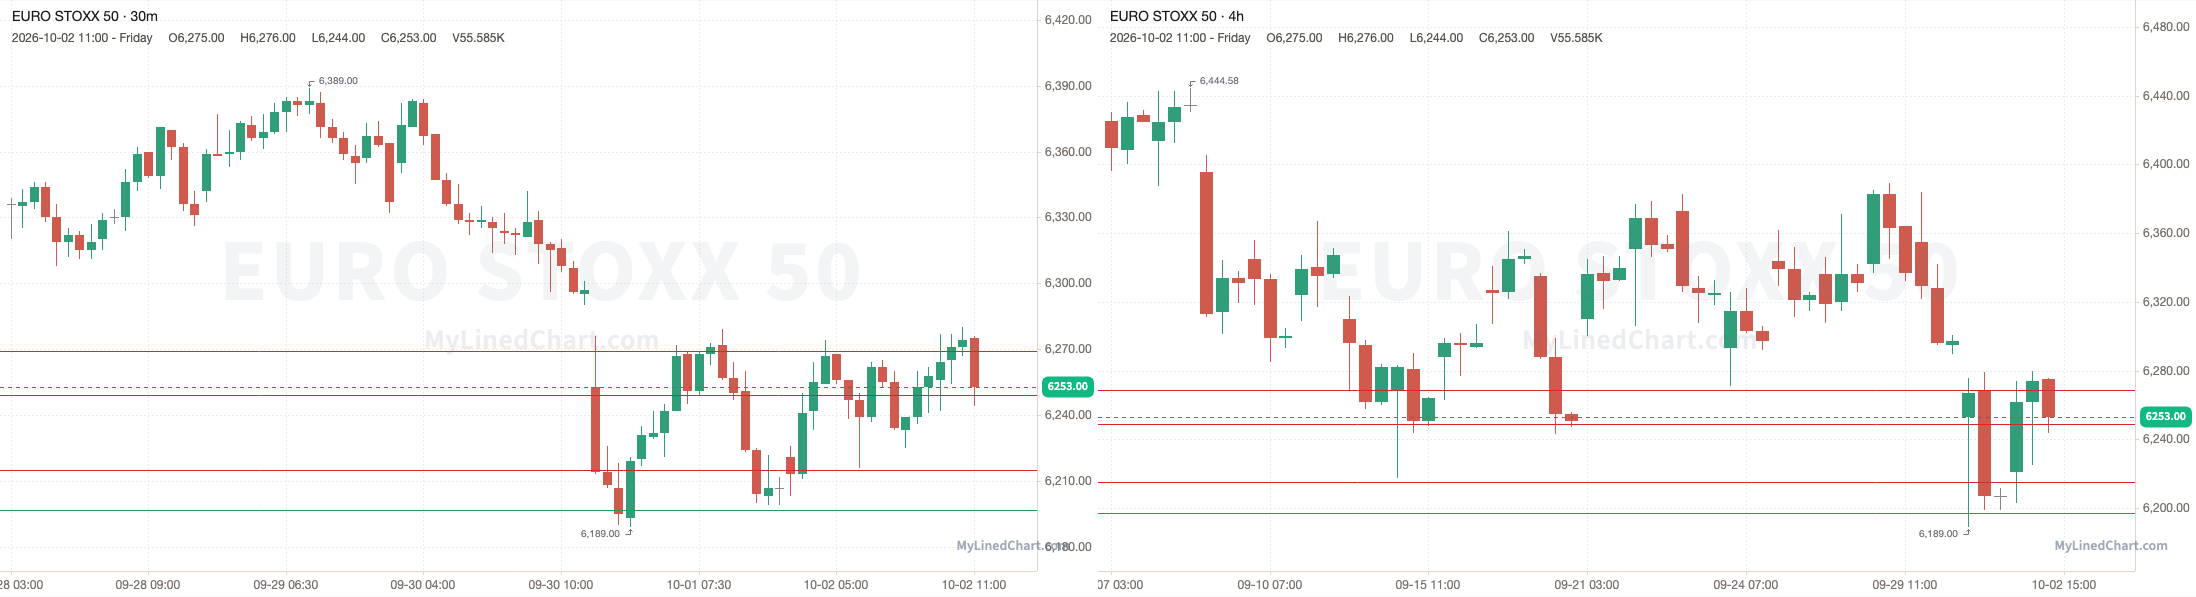
A recap of how the October 2nd Euro Stoxx 50 trading session and levels played out
Euro Stoxx 50 opened at 6221, ran up and tagged the 6249 to 6269 zone and high at 6280, then ended up closing at 6253. Finishing the trading session up 0.51% intraday.
October 2nd session levels:
All listed levels: 6197, 6215, 6249, 6269
Resistance above: 6215, 6249, 6269
Support below: 6197
Nearest pivot: 6215
Above 6215 → 6249 next
Lose 6197 → open air
See the Euro Stoxx 50 trade plan on Little Bird Trading
UK: FTSE 100
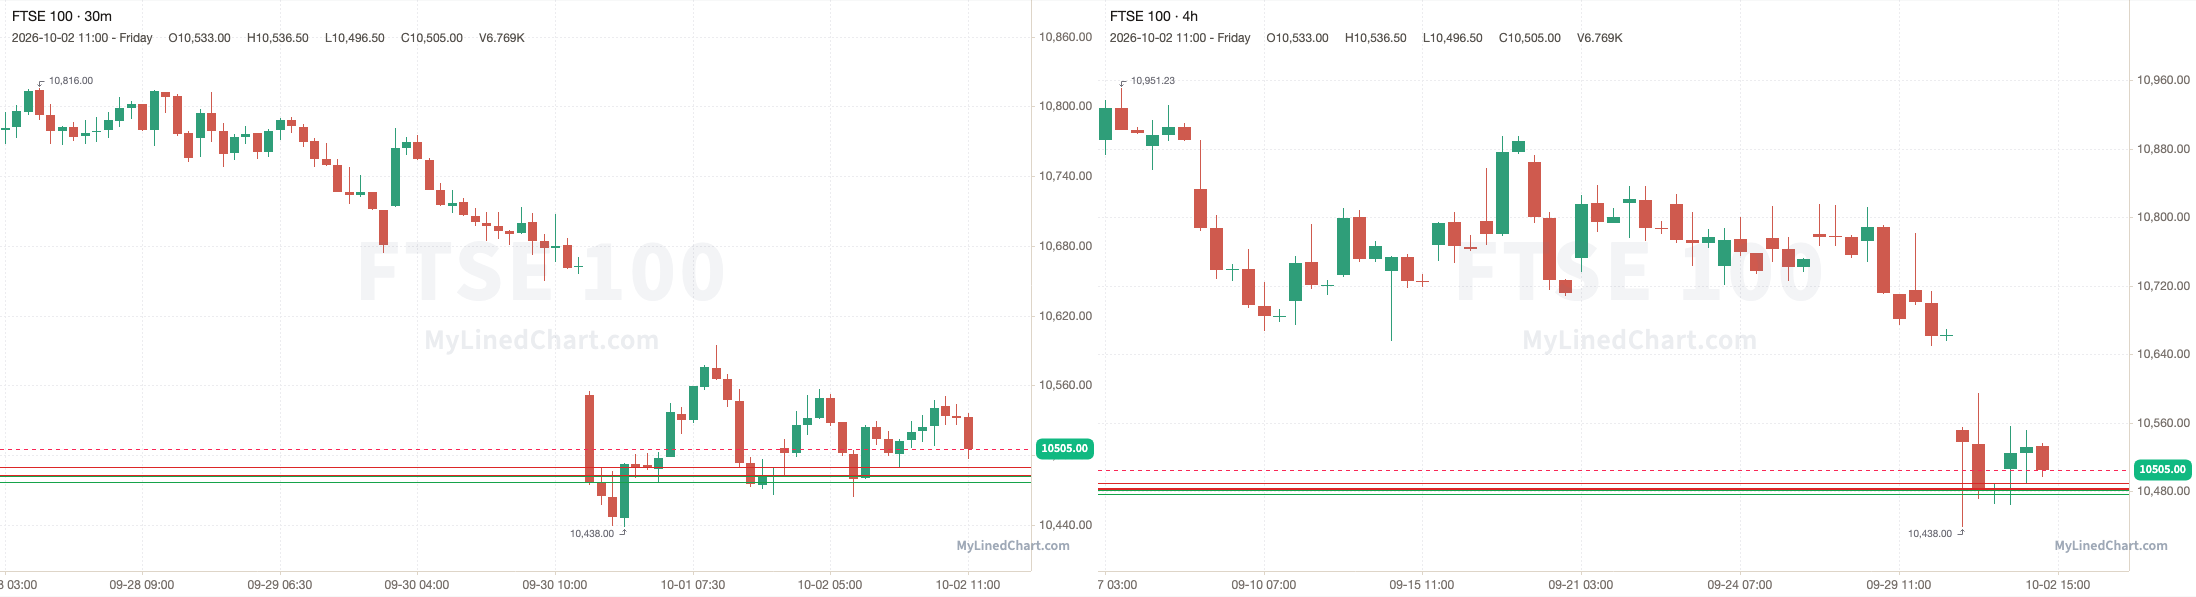
A recap of how the October 2nd FTSE 100 trading session and levels played out
FTSE 100 opened at 10506, dropped down and tagged the 10477 to 10481.57 zone and low at 10463.50, then ended up closing at 10505. Finishing the trading session down 0.01% intraday.
October 2nd session levels:
All listed levels: 10477, 10481.57, 10482.08, 10482.58, 10483.08, 10490
Resistance above: 10482.58, 10483.08, 10490
Support below: 10482.08, 10481.57, 10477
Nearest pivot: 10482.58
Above 10482.58 → 10483.08 next
Lose 10482.08 → 10481.57 next
See the FTSE 100 trade plan on Little Bird Trading
France: CAC 40
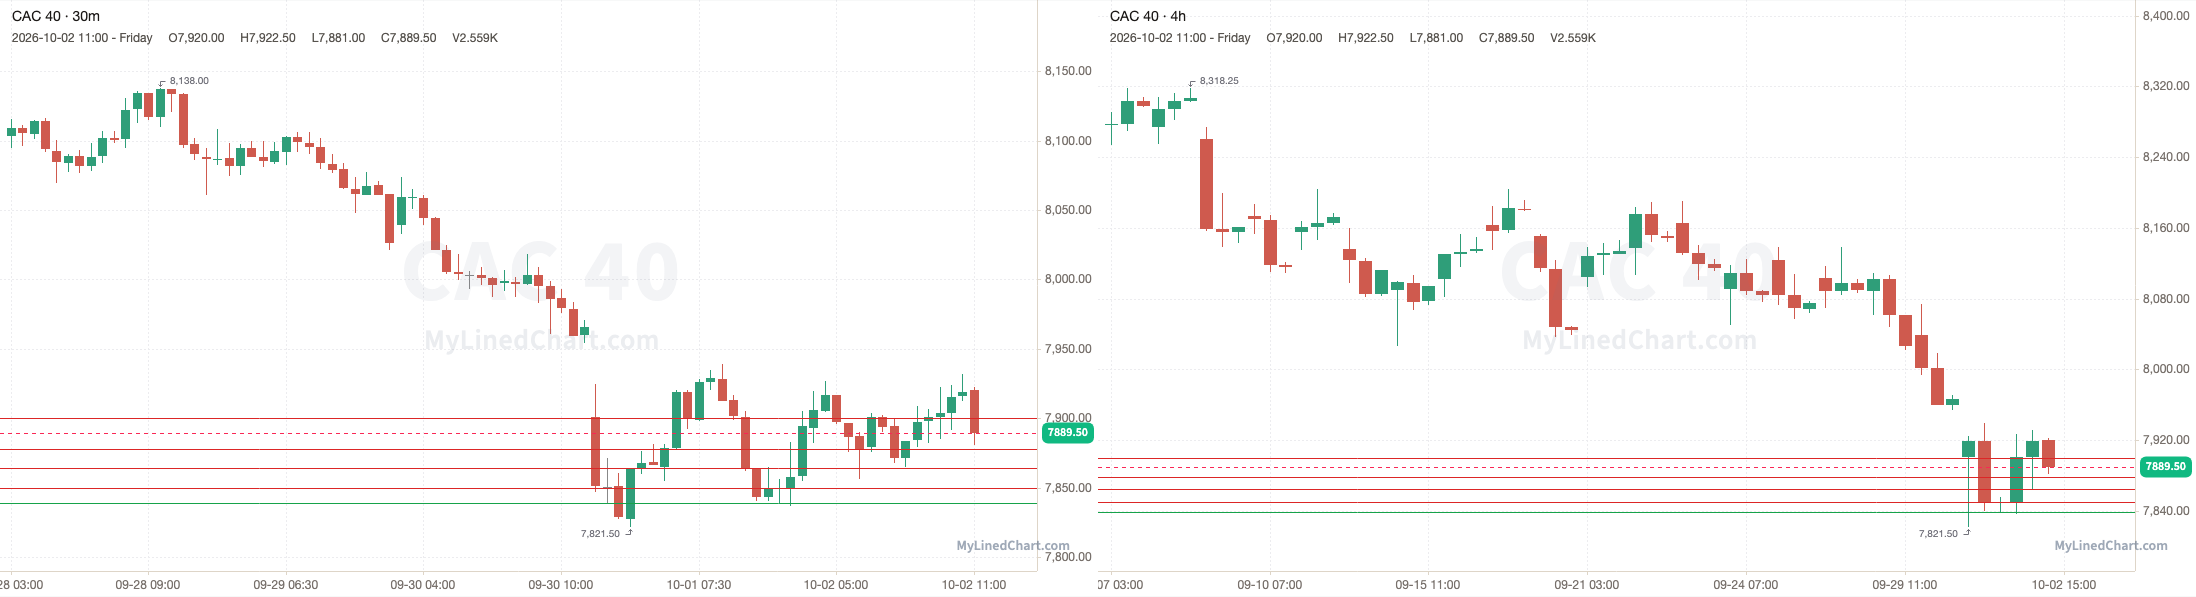
A recap of how the October 2nd CAC 40 trading session and levels played out
CAC 40 opened at 7849, ran up and tagged the 7878 to 7900 zone and high at 7931.50, then ended up closing at 7889.50. Finishing the trading session up 0.52% intraday.
October 2nd session levels:
All listed levels: 7839, 7850, 7864, 7878, 7900
Resistance above: 7864, 7878, 7900
Support below: 7839
Nearest pivot: 7850
Above 7864 → 7878 next
Lose 7839 → open air
See the CAC 40 trade plan on Little Bird Trading
Spain: IBEX 35
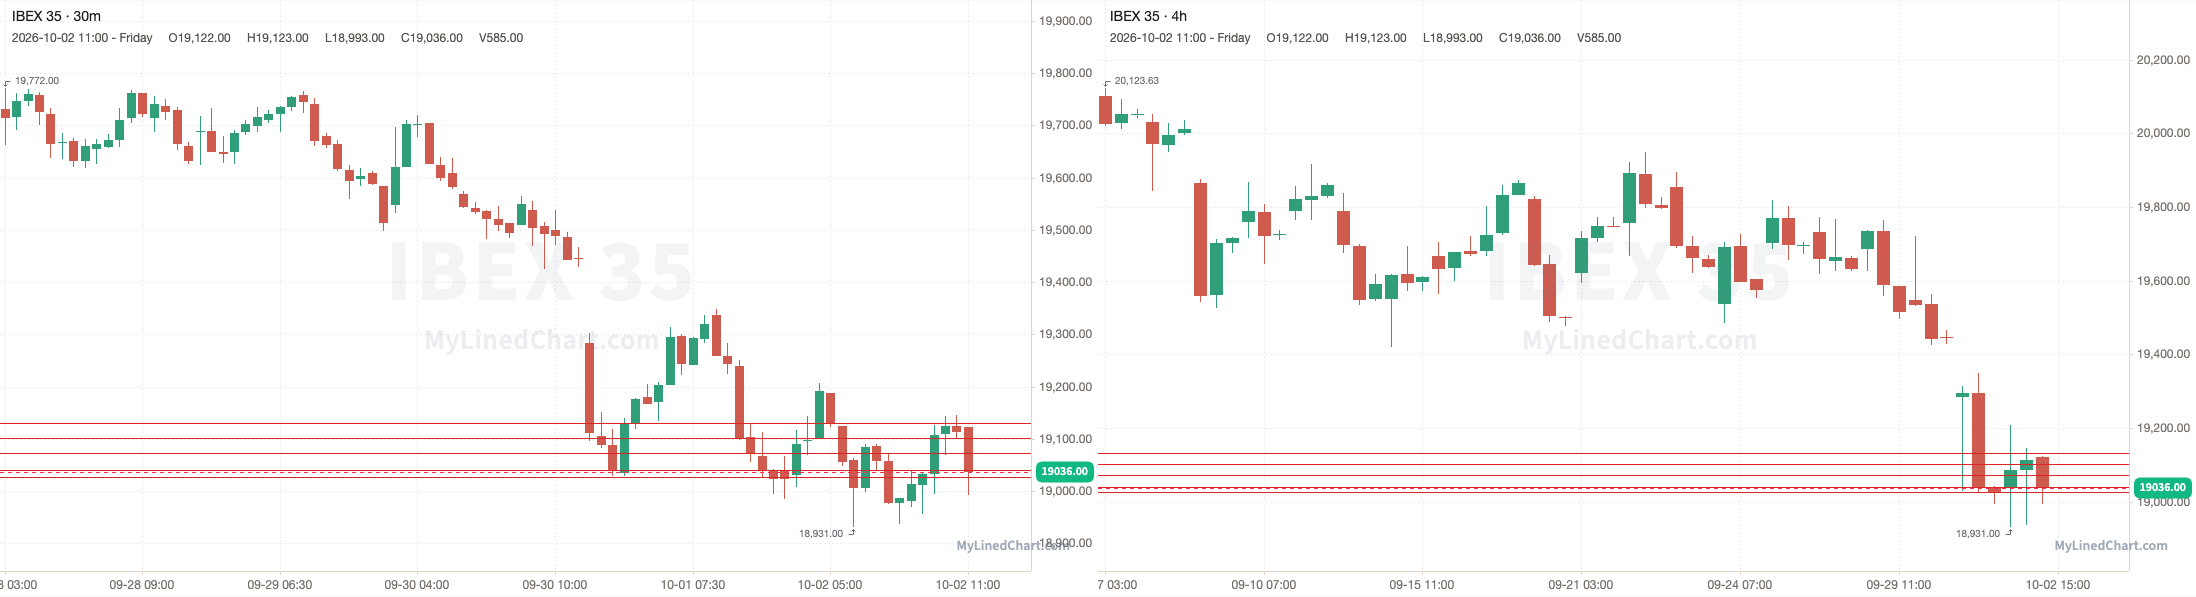
A recap of how the October 2nd IBEX 35 trading session and levels played out
IBEX 35 opened at 19039, dropped down and tagged the 19027 to 19040 zone and low at 18931, then ended up closing at 19036. Finishing the trading session down 0.02% intraday.
October 2nd session levels:
All listed levels: 18474, 19027, 19040, 19072, 19101, 19131
Resistance above: 19027, 19040, 19072, 19101, 19131
Support below: 18474
Nearest pivot: 19027
Above 19027 → 19040 next
Lose 18474 → open air
See the IBEX 35 trade plan on Little Bird Trading
Italy: FTSE MIB
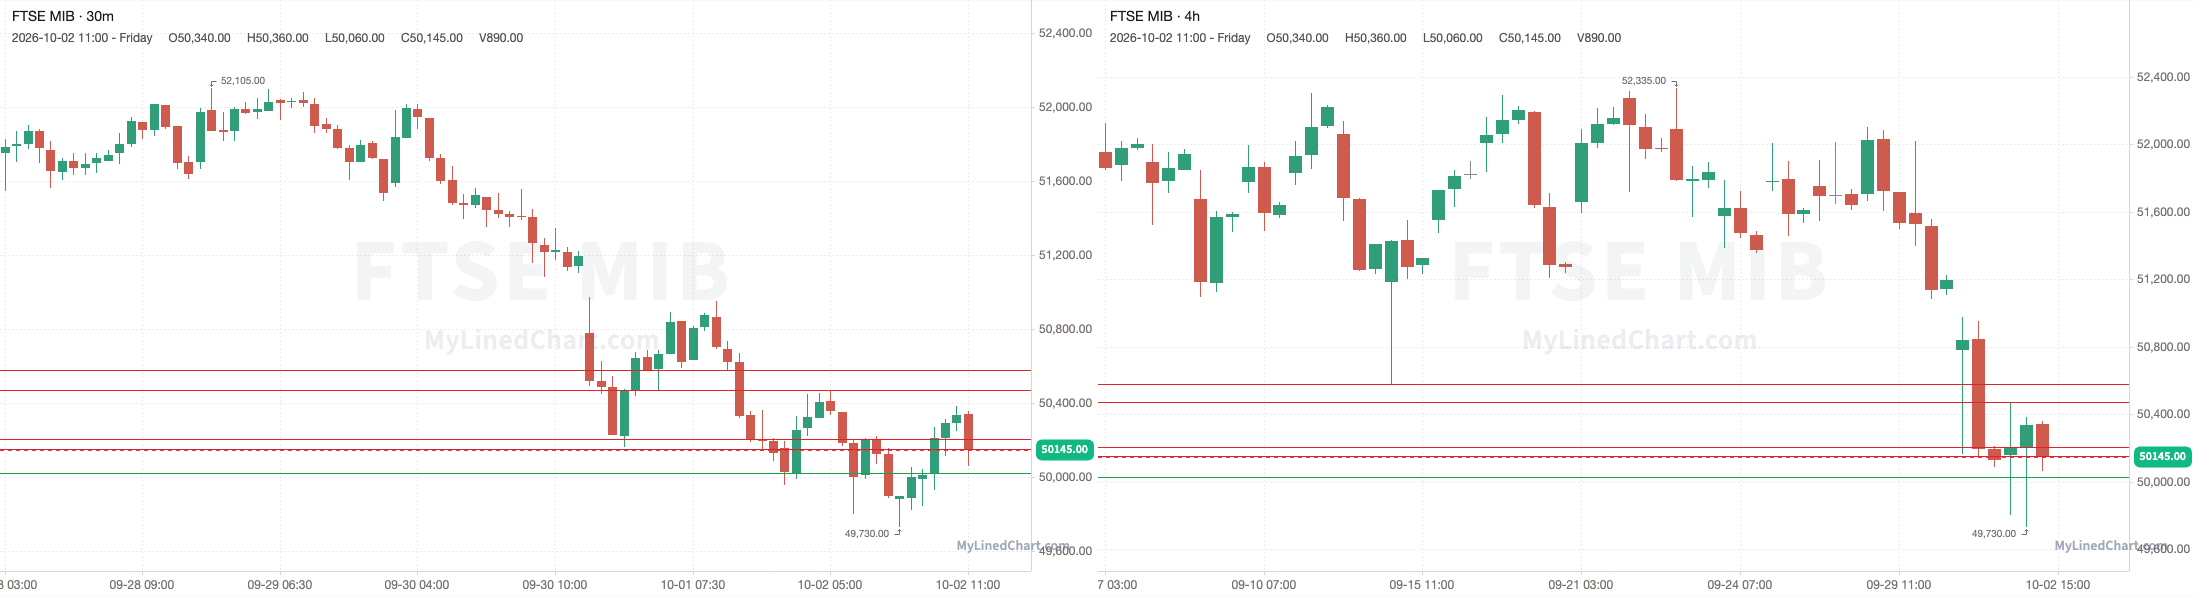
A recap of how the October 2nd FTSE MIB trading session and levels played out
FTSE MIB opened at 50155, dropped down and tagged the 50025 to 50150 zone and low at 49730, then ended up closing at 50145. Finishing the trading session down 0.02% intraday.
October 2nd session levels:
All listed levels: 50025, 50150, 50205, 50470, 50580
Resistance above: 50150, 50205, 50470, 50580
Support below: 50025
Nearest pivot: 50150
Above 50150 → 50205 next
Lose 50025 → open air
See the FTSE MIB trade plan on Little Bird Trading
Netherlands: AEX
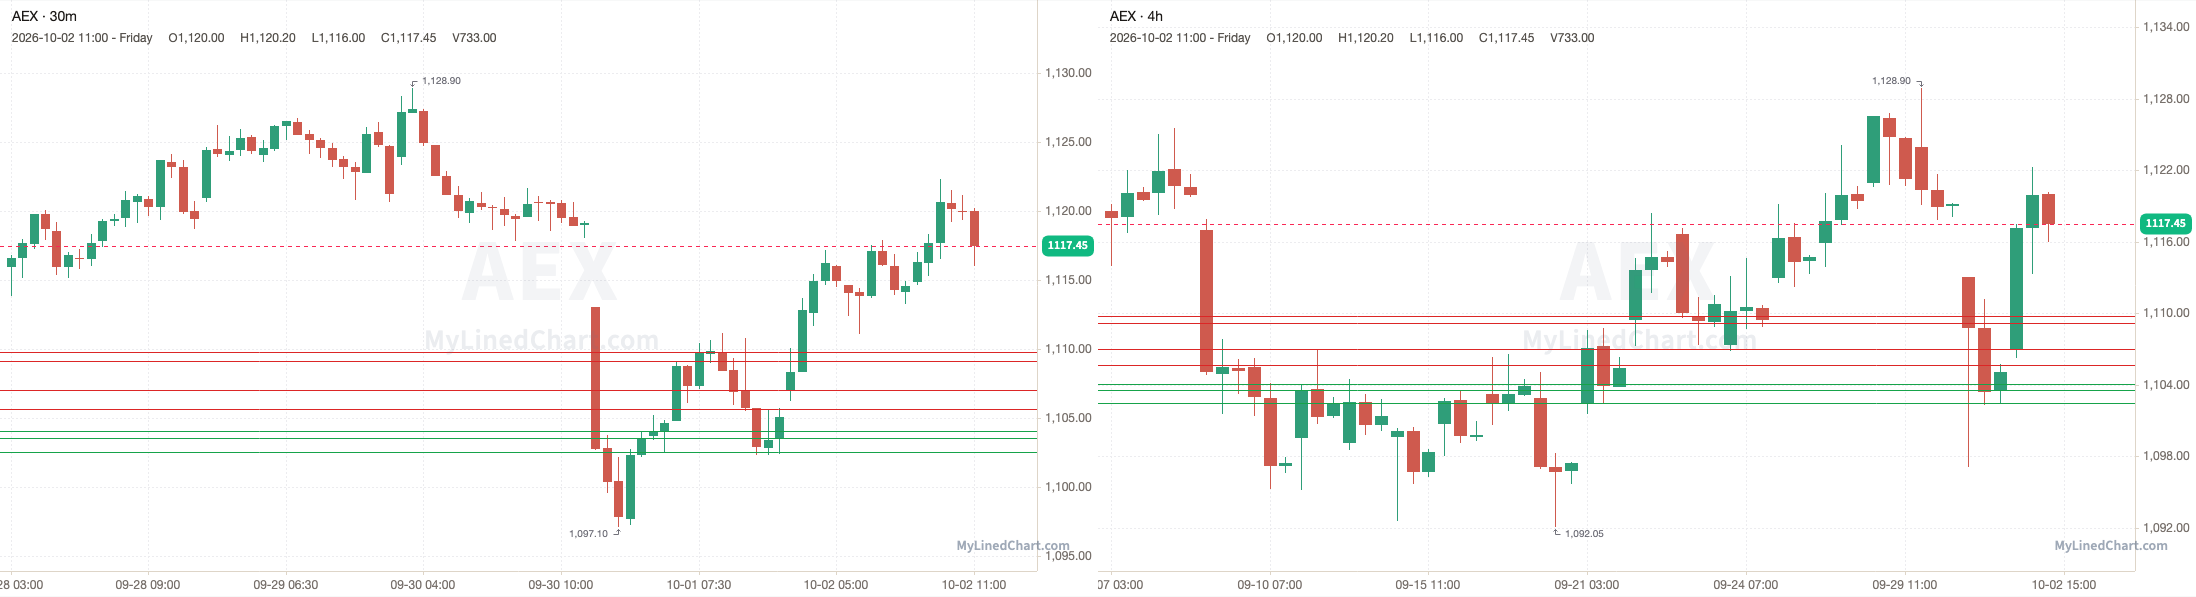
A recap of how the October 2nd AEX trading session and levels played out
AEX opened at 1106.95, ran up and tagged the 1109.15 to 1109.75 zone and high at 1122.30, then ended up closing at 1117.45. Finishing the trading session up 0.95% intraday.
October 2nd session levels:
All listed levels: 1102.50, 1103.55, 1104.05, 1105.65, 1107, 1109.15, 1109.75
Resistance above: 1105.65, 1107, 1109.15, 1109.75
Support below: 1104.05, 1103.55, 1102.50
Nearest pivot: 1105.65
Above 1105.65 → 1107 next
Lose 1104.05 → 1103.55 next
See the AEX trade plan on Little Bird Trading
Sweden: OMXS30
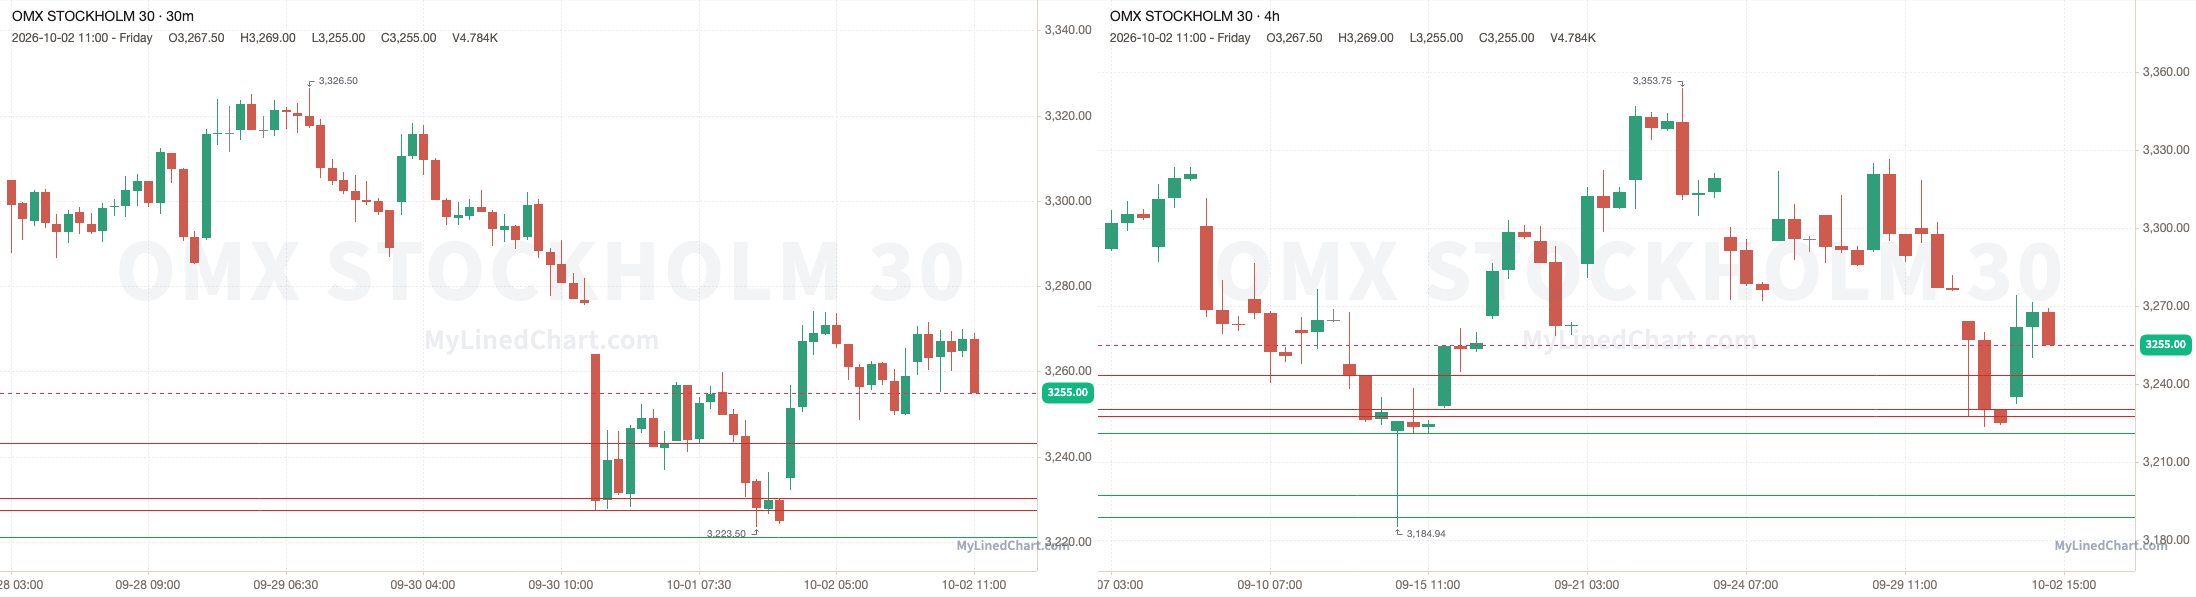
A recap of how the October 2nd OMXS30 trading session and levels played out
OMXS30 opened at 3235, ran up and tagged 3243.25 and high at 3274.25, then ended up closing at 3255. Finishing the trading session up 0.62% intraday.
October 2nd session levels:
All listed levels: 3189, 3197.25, 3221.25, 3227.50, 3230.25, 3243.25
Resistance above: 3227.50, 3230.25, 3243.25
Support below: 3221.25, 3197.25, 3189
Nearest pivot: 3227.50
Above 3227.50 → 3230.25 next
Lose 3221.25 → 3197.25 next
See the OMXS30 trade plan on Little Bird Trading
Switzerland: SMI
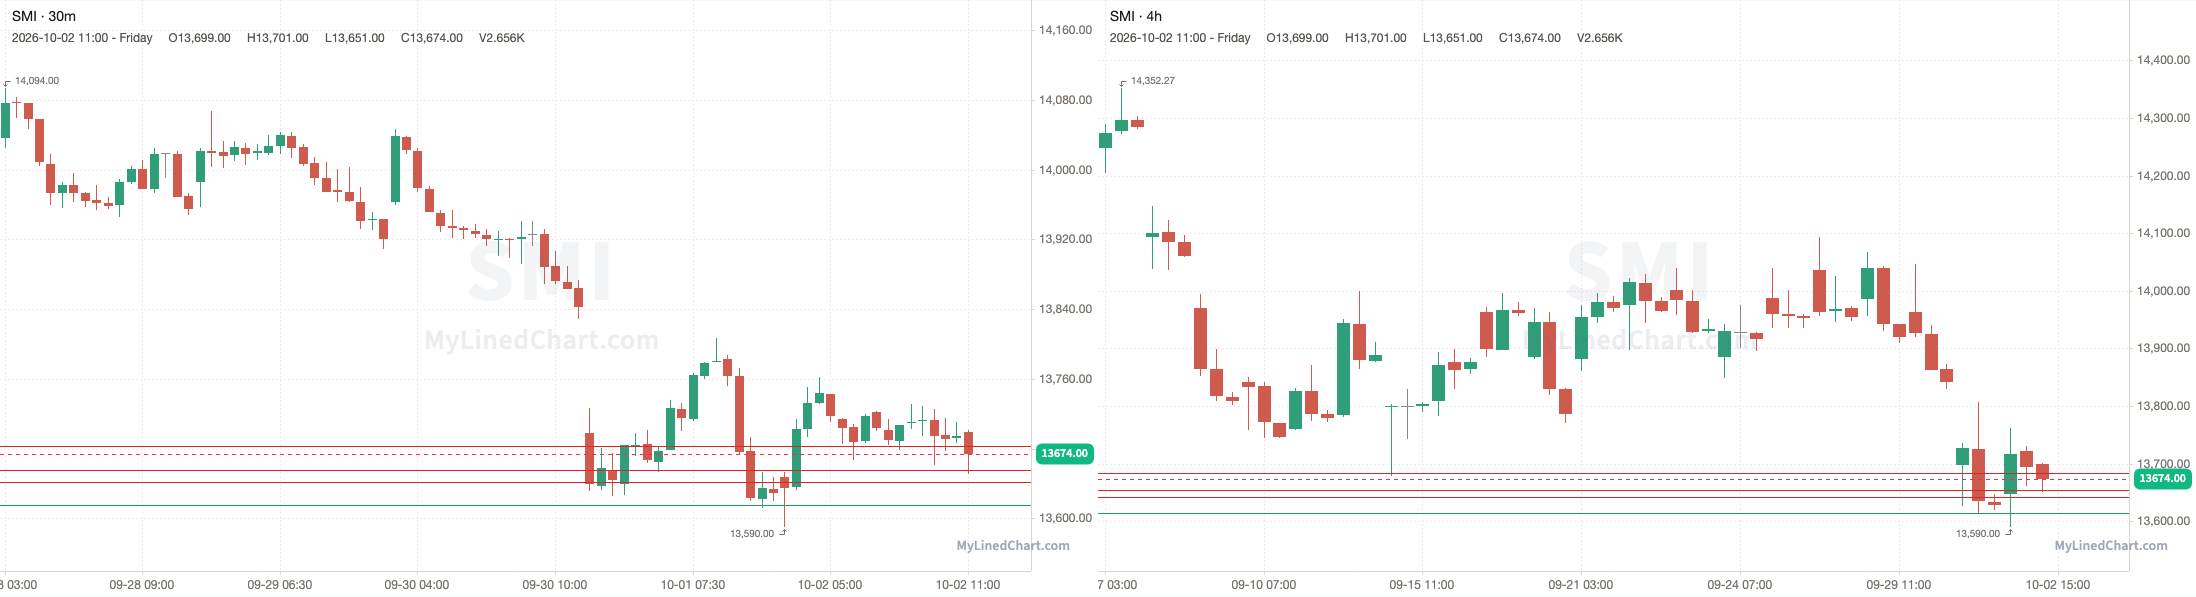
A recap of how the October 2nd SMI trading session and levels played out
SMI opened at 13648, ran up and tagged the 13655 to 13683 zone and high at 13762, then ended up closing at 13674. Finishing the trading session up 0.19% intraday.
October 2nd session levels:
All listed levels: 13615, 13642, 13655, 13683
Resistance above: 13642, 13655, 13683
Support below: 13615
Nearest pivot: 13642
Above 13642 → 13655 next
Lose 13615 → open air
See the SMI trade plan on Little Bird Trading
Latin America
Mexico: S&P/BMV IPC
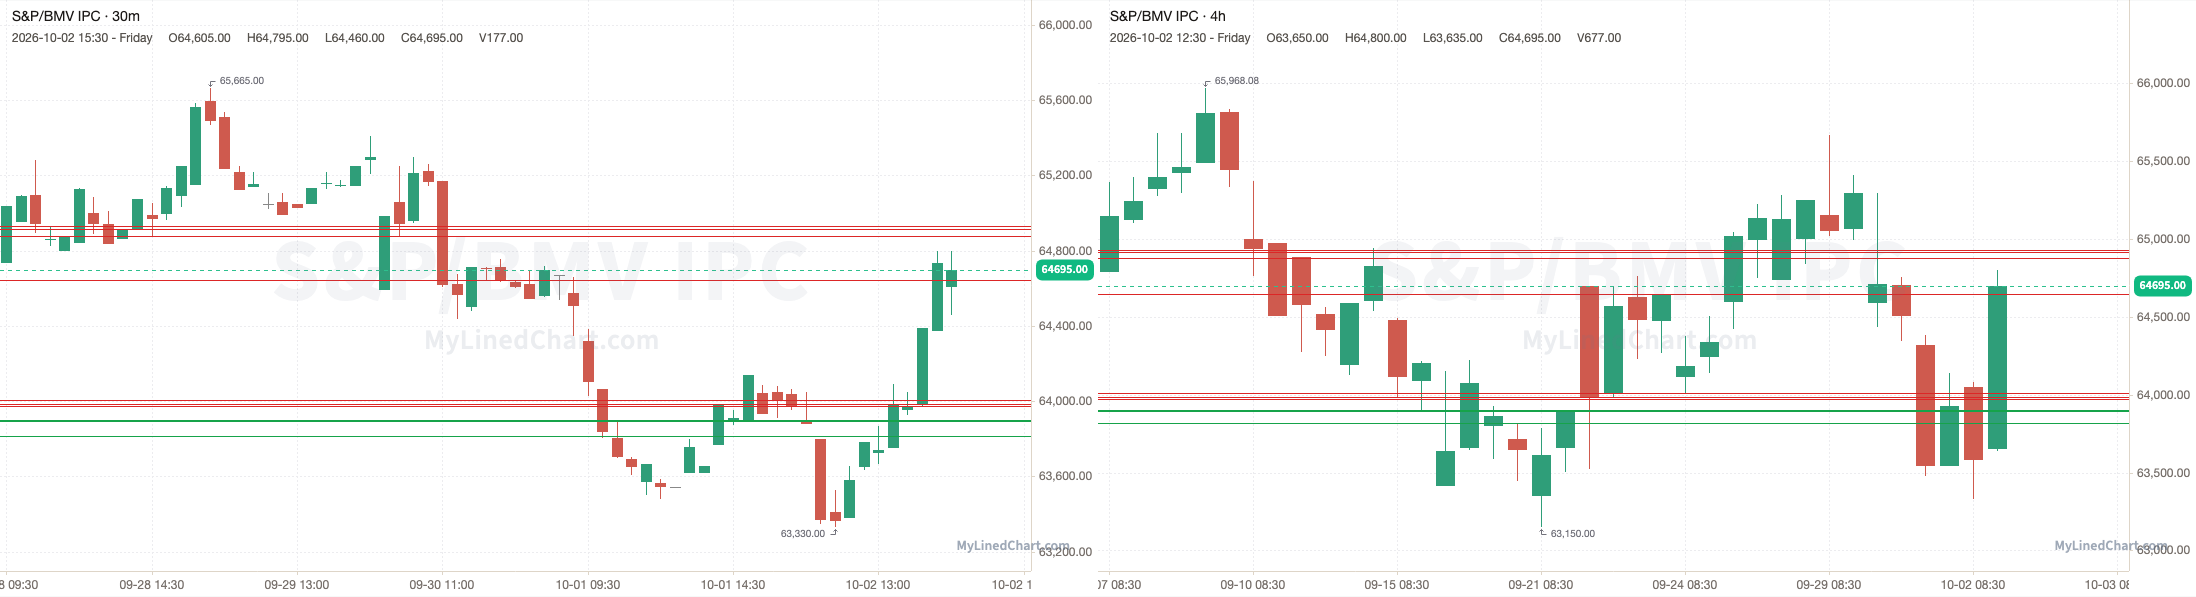
A recap of how the October 2nd S&P/BMV IPC trading session and levels played out
S&P/BMV IPC opened at 64050, ran up and tagged the 64008 to 64645 zone and high at 64800, then ended up closing at 64695. Finishing the trading session up 1.01% intraday.
October 2nd session levels:
All listed levels: 63815, 63893, 63900, 63973, 63986, 64008, 64645, 64875, 64915, 64930
Resistance above: 63973, 63986, 64008, 64645, 64875, 64915, 64930
Support below: 63900, 63893, 63815
Nearest pivot: 63900
Above 63973 → 63986 next
Lose 63900 → 63893 next
See the S&P/BMV IPC trade plan on Little Bird Trading
Brazil: Ibovespa
No Ibovespa review available today.
See the Ibovespa trade plan on Little Bird Trading
Get each market's levels in real time as they're posted. Sign up on Little Bird Trading.
Pro: next-session levels for the markets you trade, on Little Bird Trading.
Disclaimer: Little Bird Trading and any of its associations may or may not, whether long or short, have a position in any instruments. Not investment advice. Provided for informational purposes only. Not a recommendation or endorsement. Not registered or licensed. Model portfolios are property of their respective owners. All data is sourced from publicly available information. No guarantee is being made or offered. Not responsible for financial loss or ruin. Little Bird Trading may earn a commission if you purchase through links on the site.
Day Trade Levels for the October 5th Trading Session:
Enjoying this content?
Subscribe on Substack