

SPY, DAX +18 Global Market Levels: Sept 30th Trade Plan Plus Charts
Support, resistance and pivot levels for SPY, ES, QQQ, NQ and 19 stock markets across Asia, Europe and the Americas ahead of the September 30th session, plus how the last session's levels traded.
MyLinedChart works however you get to a trade: AI-Assisted, Discretionary, Quant, or Macro. Export your lines, levels plus the whole chart as XLSX, JSON, or CSV. Or, let AI do all the work for you.
Here’s an overview of how MyLinedChart compares to Trading View and TrendSpider. Available on Windows, Apple and Android.
Looking for a pro to build your trading workflows? Reach out on Upwork.
Get each market's levels in real time as they're posted. Sign up on Little Bird Trading.
US
A recap of how the September 29th trading session and levels played out
No day-trade levels set up on September 29, so there was nothing to review. A patience day: protect capital and wait for the levels to come back.
See the SPY, ES, QQQ & NQ trade plan on Little Bird Trading
Asia
Japan: Nikkei 225
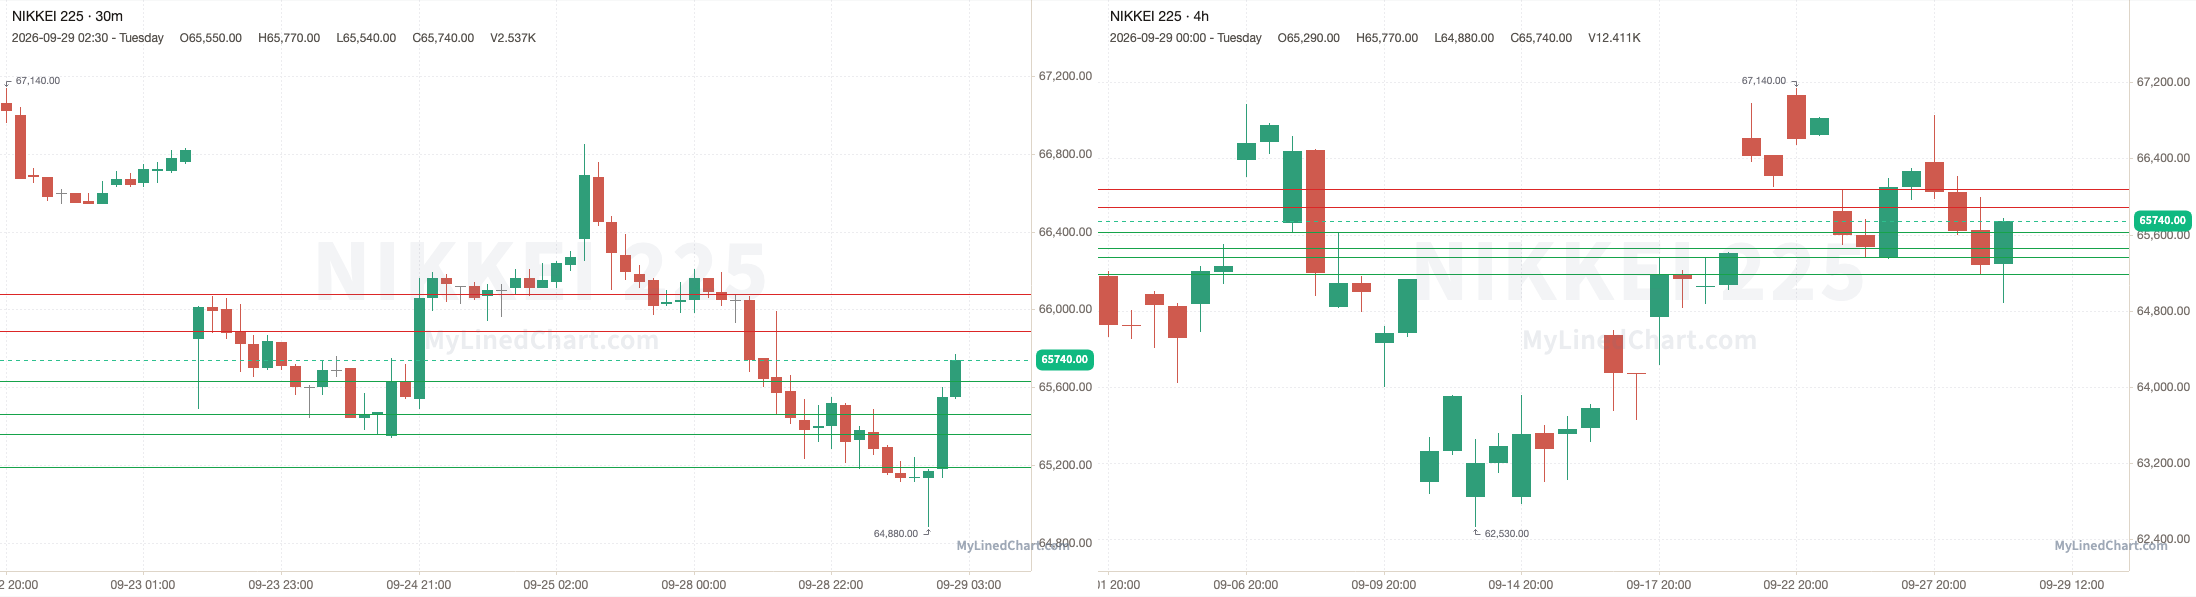
A recap of how the September 29th Nikkei 225 trading session and levels played out
Nikkei 225 opened at 65650, ran up and tagged the 65630 to 65890 zone and high at 65990, then ended up closing at 65740. Finishing the trading session up 0.14% intraday and up 0.15% overall.
September 29th session levels:
All listed levels: 65190, 65360, 65460, 65630, 65890, 66080
Resistance above: 65890, 66080
Support below: 65630, 65460, 65360, 65190
Nearest pivot: 65630
Above 65890 → 66080 next
Lose 65630 → 65460 next
See the Nikkei 225 trade plan on Little Bird Trading
Korea: KOSPI 200
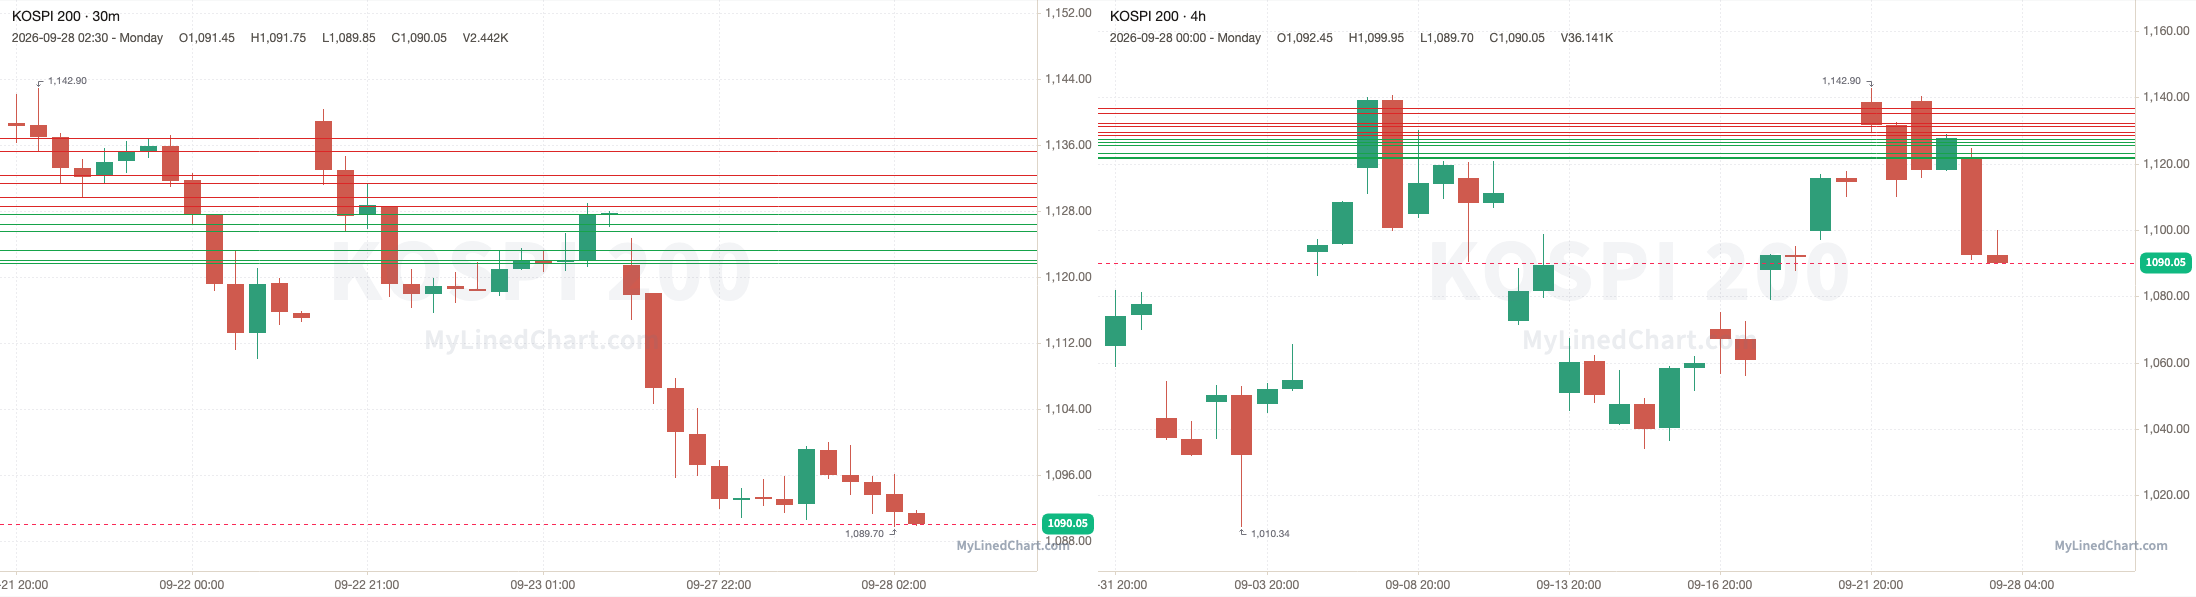
A recap of how the September 28th KOSPI 200 trading session and levels played out
KOSPI 200 opened at 1121.50, dropped down and tagged the 1121.70 to 1122.05 zone and low at 1089.70, then ended up closing at 1090.05. Finishing the trading session down 2.80% intraday and down 3.34% overall.
September 28th session levels:
All listed levels: 1121.70, 1122.05, 1123.20, 1125.55, 1126.45, 1127.60, 1128.55, 1129.65, 1131.35, 1132.35, 1135.25, 1136.85
Resistance above: 1128.55, 1129.65, 1131.35, 1132.35, 1135.25, 1136.85
Support below: 1127.60, 1126.45, 1125.55, 1123.20, 1122.05, 1121.70
Nearest pivot: 1127.60
Above 1128.55 → 1129.65 next
Lose 1127.60 → 1126.45 next
See the KOSPI 200 trade plan on Little Bird Trading
China: FTSE China A50
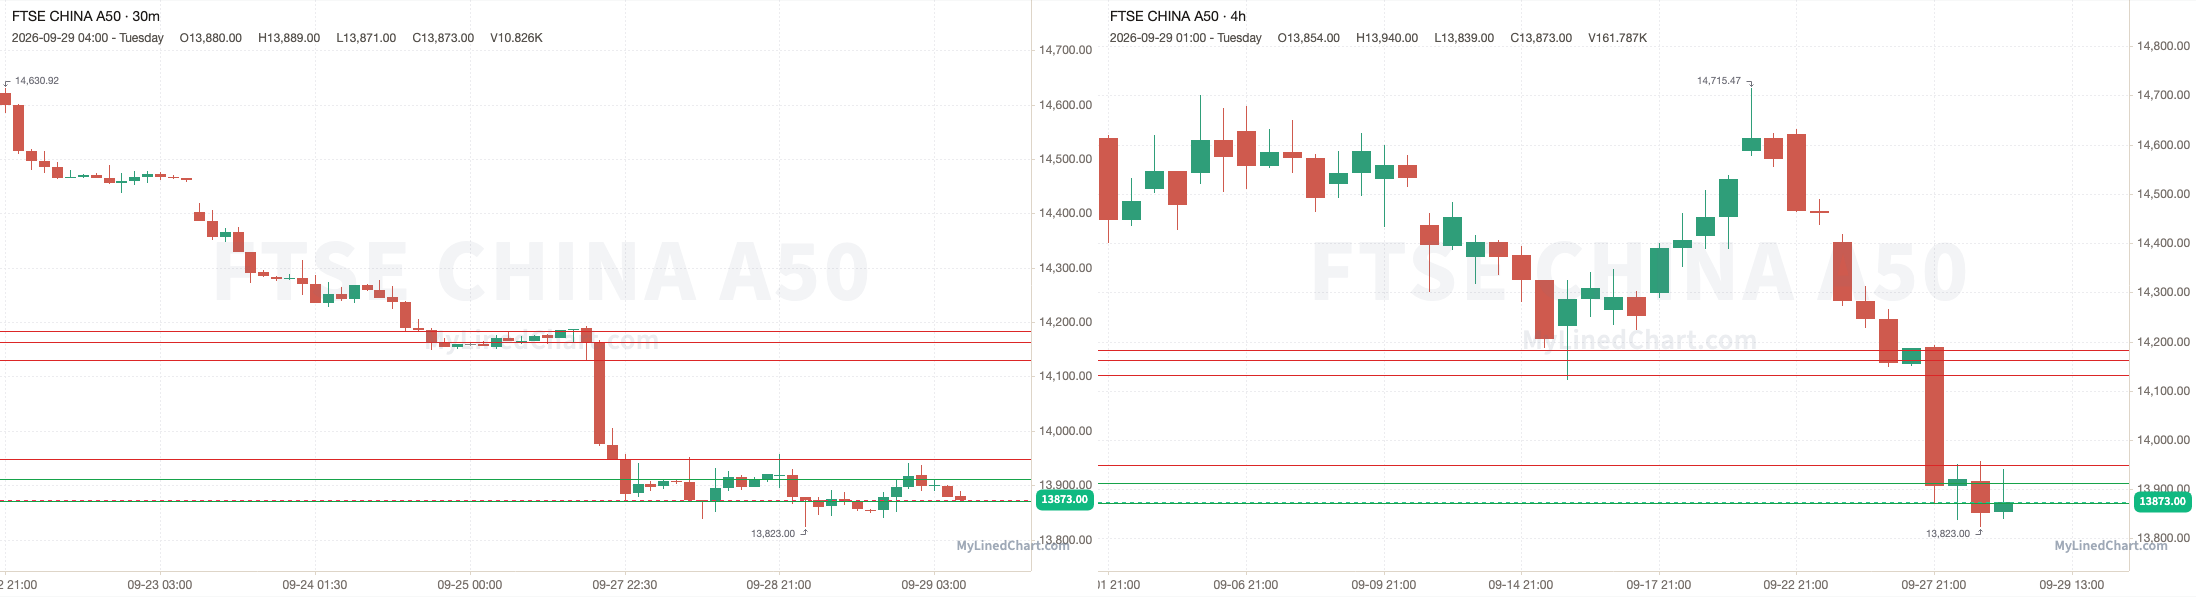
A recap of how the September 29th FTSE China A50 trading session and levels played out
FTSE China A50 opened at 13917, dropped down and tagged the 13871 to 13912 zone and low at 13823, then ended up closing at 13873. Finishing the trading session down 0.32% intraday and down 0.34% overall.
September 29th session levels:
All listed levels: 13871, 13912, 13949, 14131, 14163, 14183
Resistance above: 13949, 14131, 14163, 14183
Support below: 13912, 13871
Nearest pivot: 13912
Above 13949 → 14131 next
Lose 13912 → 13871 next
See the FTSE China A50 trade plan on Little Bird Trading
Hong Kong: Hang Seng
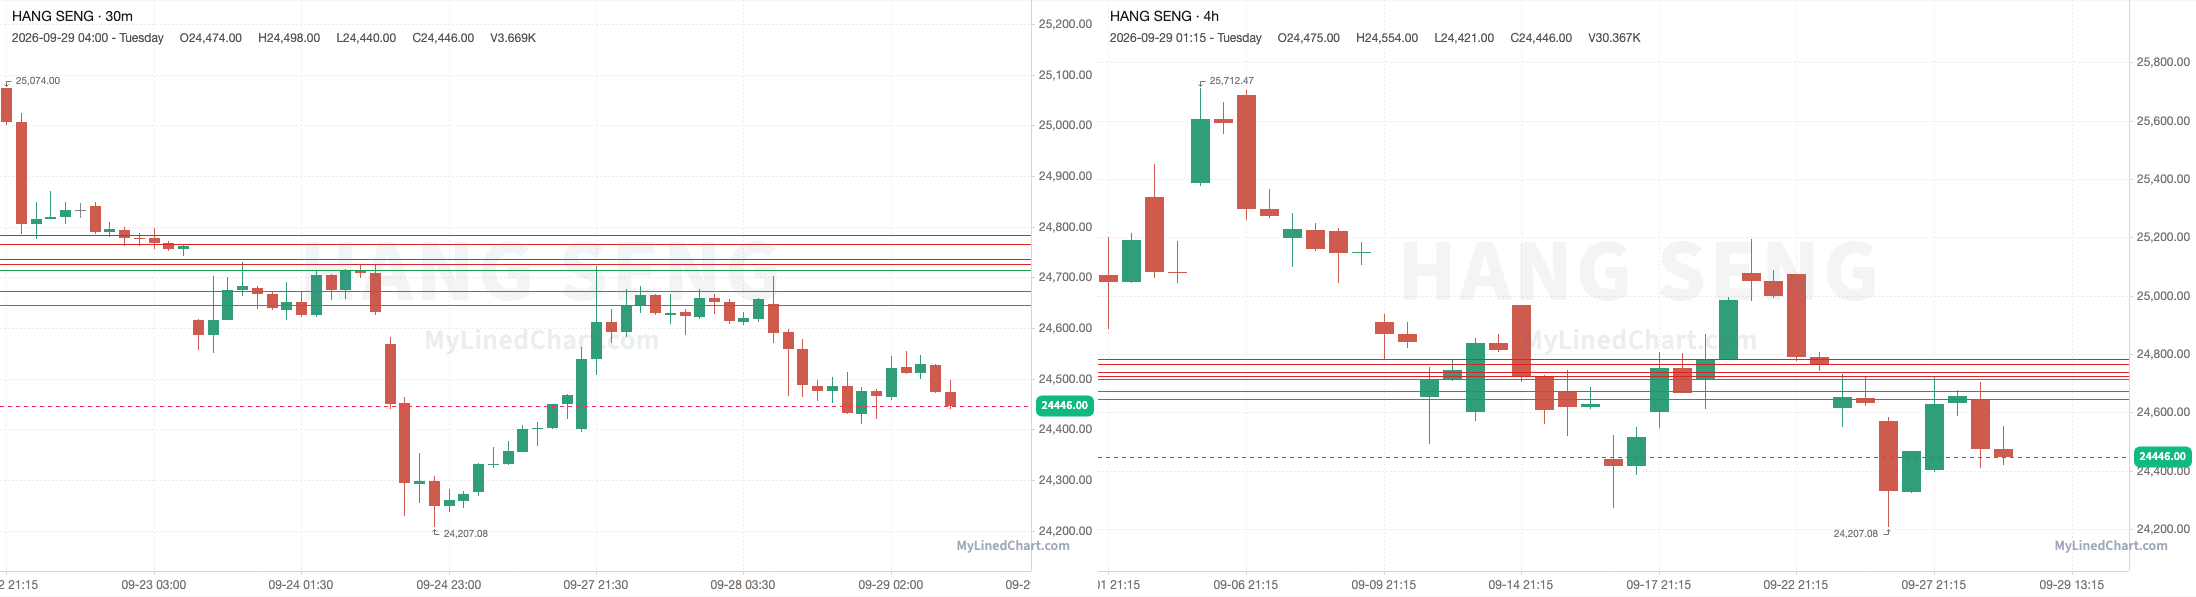
A recap of how the September 29th Hang Seng trading session and levels played out
Hang Seng opened at 24647, dropped down and tagged the 24646 to 24673 zone and low at 24410, then ended up closing at 24446. Finishing the trading session down 0.82% intraday and down 1.09% overall.
September 29th session levels:
All listed levels: 24646, 24673, 24714, 24726, 24737, 24765, 24783
Resistance above: 24726, 24737, 24765, 24783
Support below: 24714, 24673, 24646
Nearest pivot: 24714
Above 24726 → 24737 next
Lose 24714 → 24673 next
See the Hang Seng trade plan on Little Bird Trading
Taiwan: FTSE Taiwan
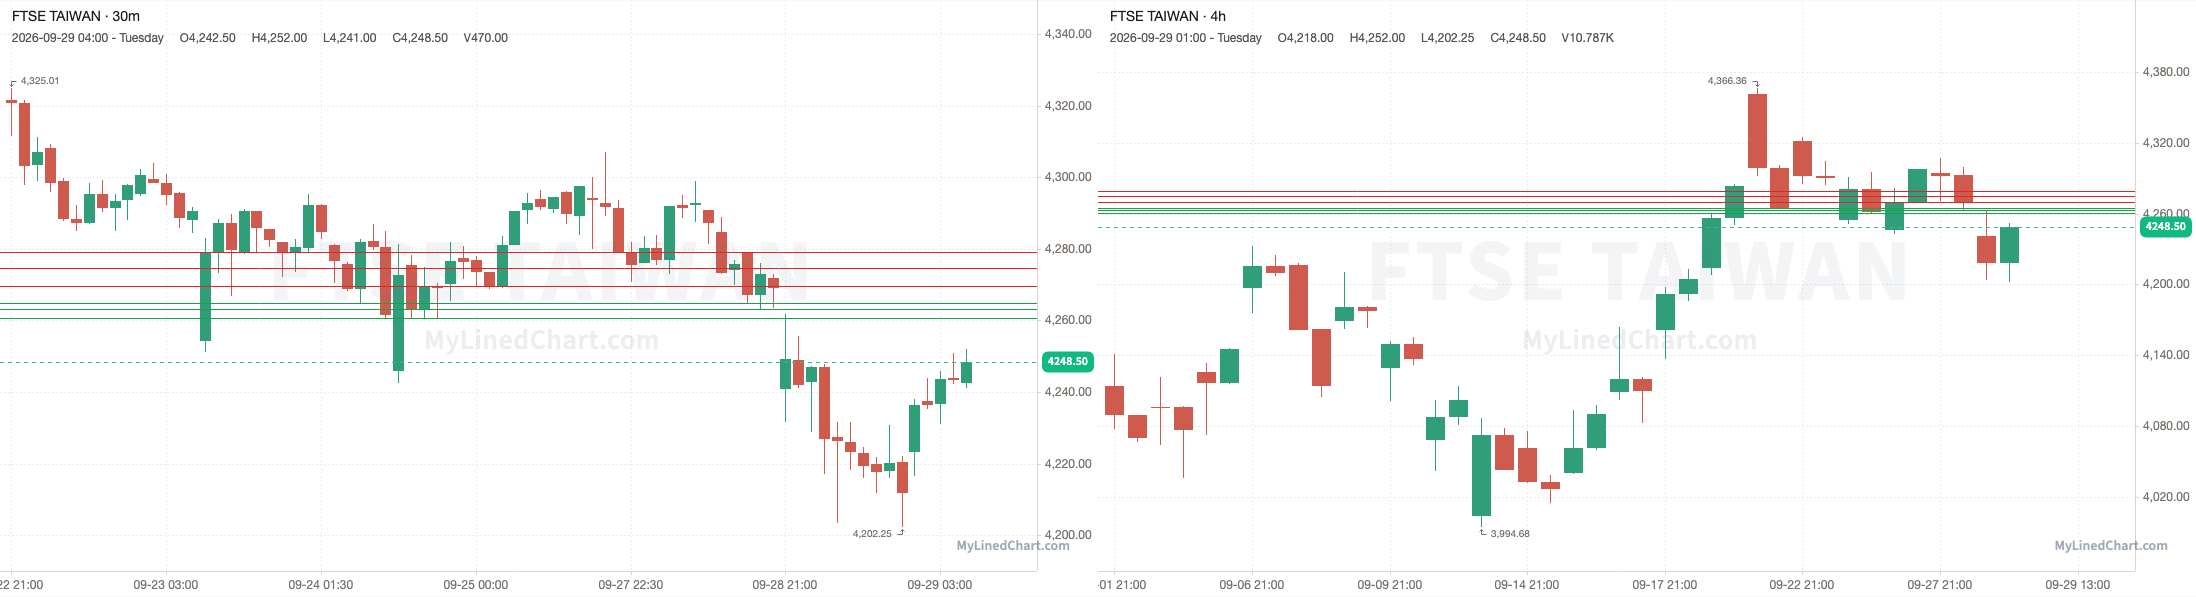
A recap of how the September 29th FTSE Taiwan trading session and levels played out
FTSE Taiwan opened at 4240.75, ran up and tagged 4260.75 and high at 4261.75, then ended up closing at 4248.50. Finishing the trading session up 0.18% intraday and down 0.48% overall.
September 29th session levels:
All listed levels: 4260.75, 4263.25, 4265, 4269.75, 4274.75, 4279.25
Resistance above: 4269.75, 4274.75, 4279.25
Support below: 4265, 4263.25, 4260.75
Nearest pivot: 4265
Above 4269.75 → 4274.75 next
Lose 4265 → 4263.25 next
See the FTSE Taiwan trade plan on Little Bird Trading
Singapore: MSCI Singapore
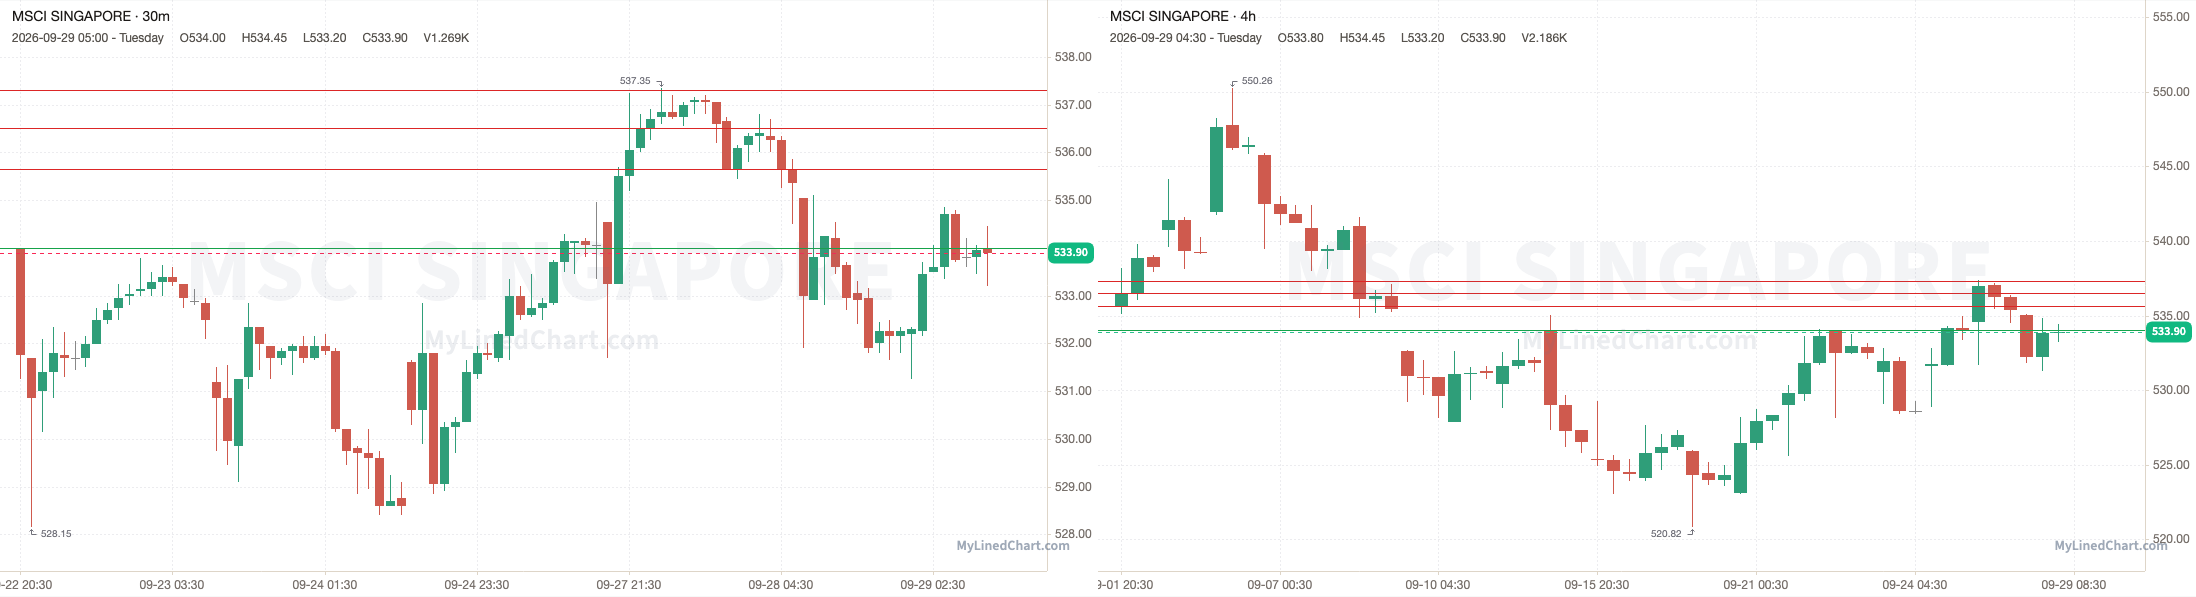
A recap of how the September 29th MSCI Singapore trading session and levels played out
MSCI Singapore opened at 535.05, dropped down and tagged 534 and low at 531.25, then ended up closing at 533.90. Finishing the trading session down 0.21% intraday and down 0.27% overall.
September 29th session levels:
All listed levels: 534, 535.65, 536.50, 537.30
Resistance above: 535.65, 536.50, 537.30
Support below: 534
Nearest pivot: 535.65
Above 535.65 → 536.50 next
Lose 534 → open air
See the MSCI Singapore trade plan on Little Bird Trading
India: NIFTY 50
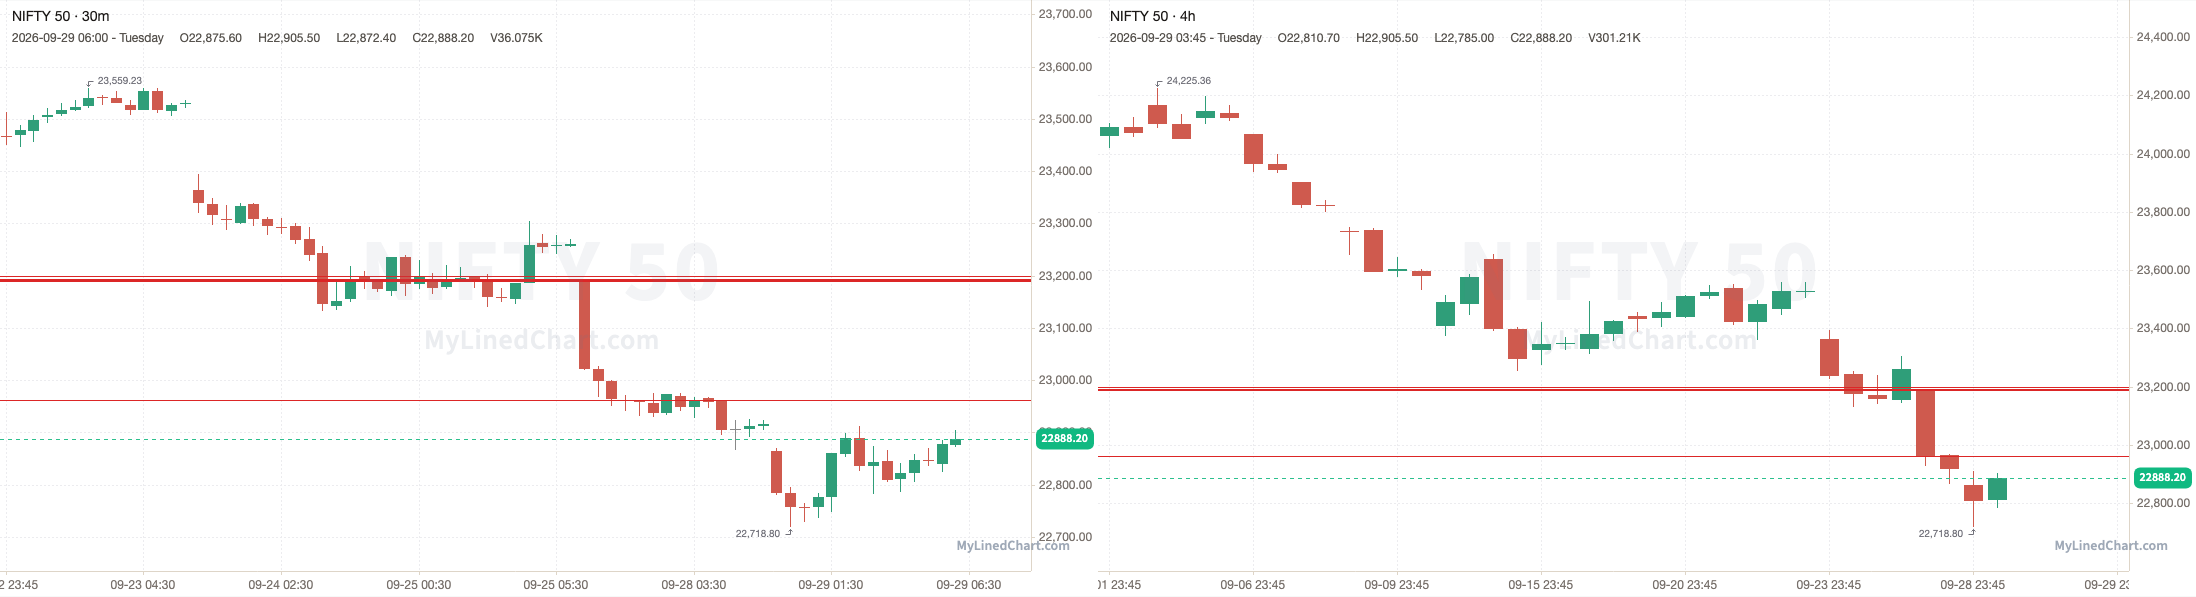
A recap of how the September 29th NIFTY 50 trading session and levels played out
NIFTY opened at 22864.40, stayed below every level, with a high of 22911.50 and a low of 22718.80, then ended up closing at 22888.20. Finishing the trading session up 0.10% intraday and down 0.12% overall.
September 29th session levels:
All listed levels: 22961.10, 23189, 23191.10, 23192.70, 23198.80
Resistance above: 22961.10, 23189, 23191.10, 23192.70, 23198.80
Support below: none
Nearest pivot: 22961.10
Above 22961.10 → 23189 next
See the NIFTY 50 trade plan on Little Bird Trading
Australia: SPI
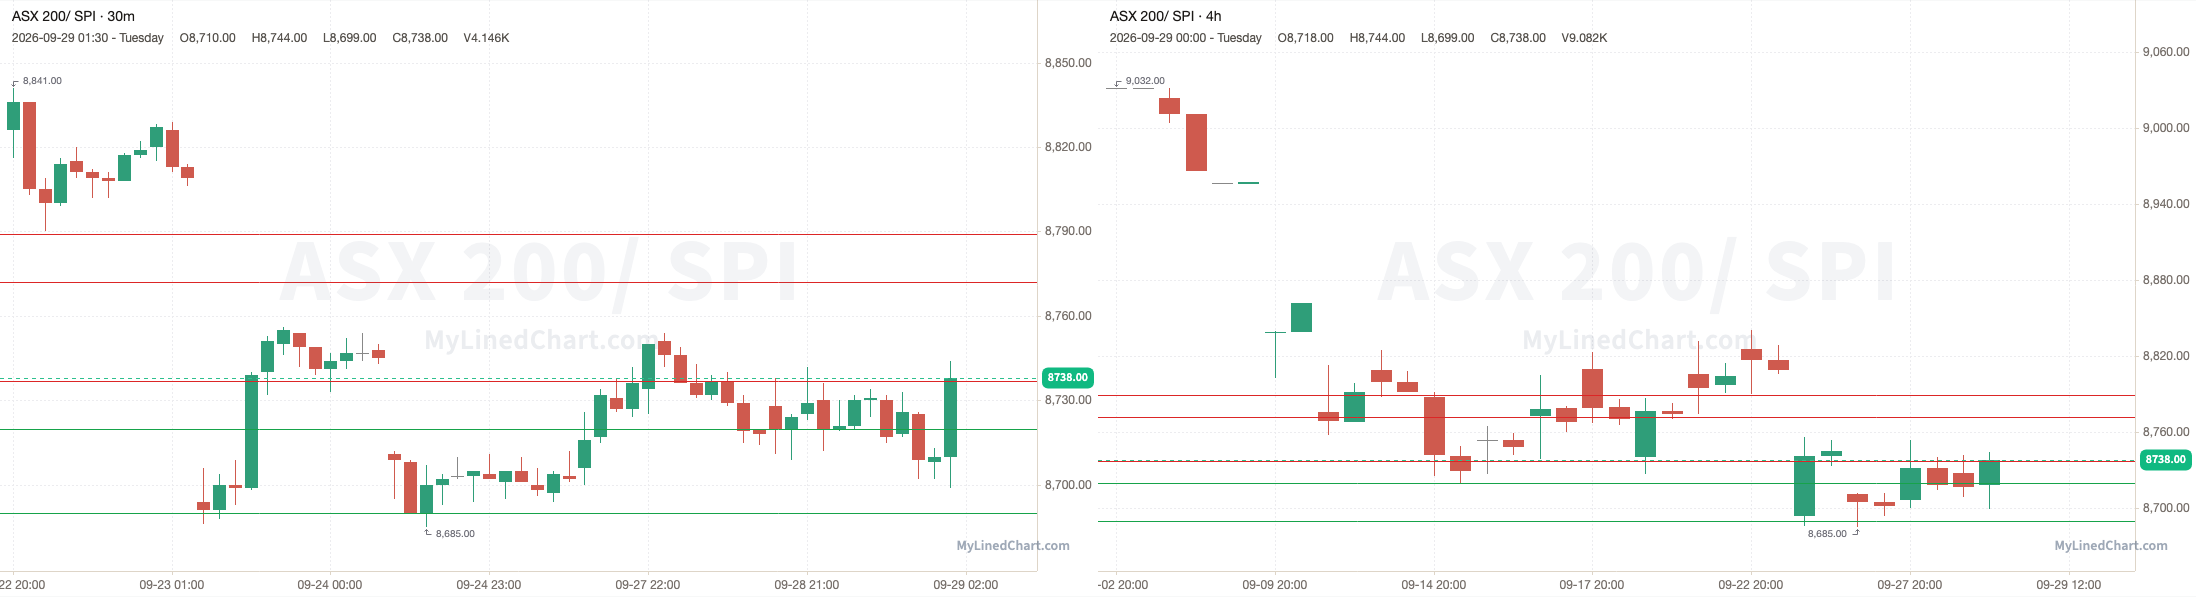
A recap of how the September 29th SPI trading session and levels played out
SPI opened at 8728, ran up and tagged the 8720 to 8737 zone and high at 8760, then ended up closing at 8740. Finishing the trading session up 0.14% intraday and up 0.22% overall.
September 29th session levels:
All listed levels: 8690, 8720, 8737, 8772, 8789
Resistance above: 8737, 8772, 8789
Support below: 8720, 8690
Nearest pivot: 8720
Above 8737 → 8772 next
Lose 8720 → 8690 next
See the SPI trade plan on Little Bird Trading
Europe
Germany: DAX 40
A recap of how the September 29th DAX 40 trading session and levels played out
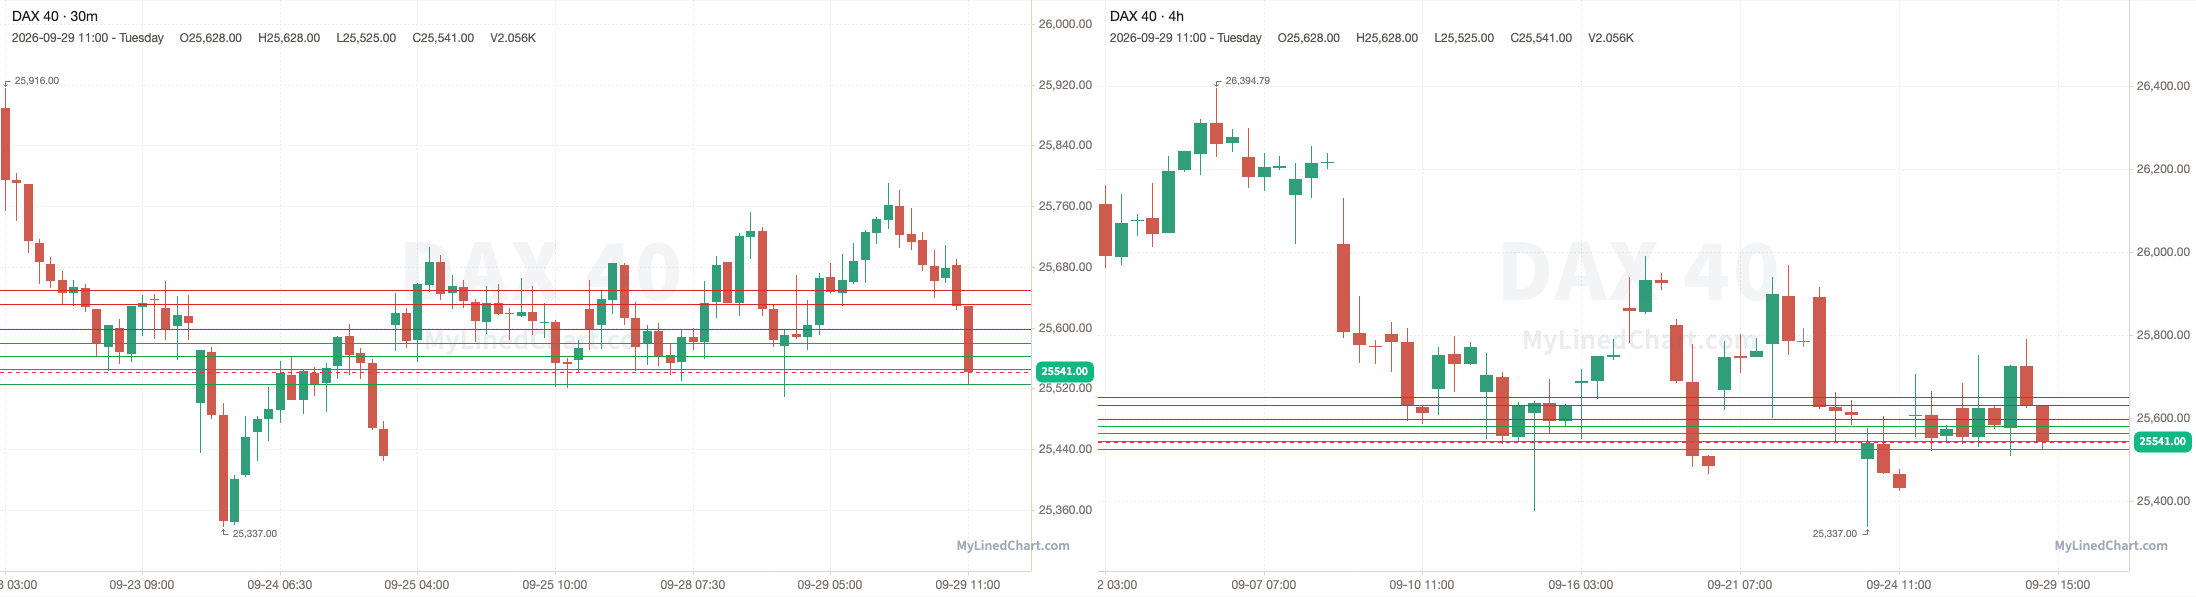
DAX 40 opened at 25576, dropped down and tagged the 25526 to 25545 zone and low at 25508, then ended up closing at 25541. Finishing the trading session down 0.14% intraday and down 0.17% overall.
September 29th session levels:
All listed levels: 25526, 25545, 25563, 25580, 25598, 25631, 25650
Resistance above: 25598, 25631, 25650
Support below: 25580, 25563, 25545, 25526
Nearest pivot: 25580
Above 25598 → 25631 next
Lose 25580 → 25563 next
See the DAX 40 trade plan on Little Bird Trading
Eurozone: Euro Stoxx 50
A recap of how the September 29th Euro Stoxx 50 trading session and levels played out
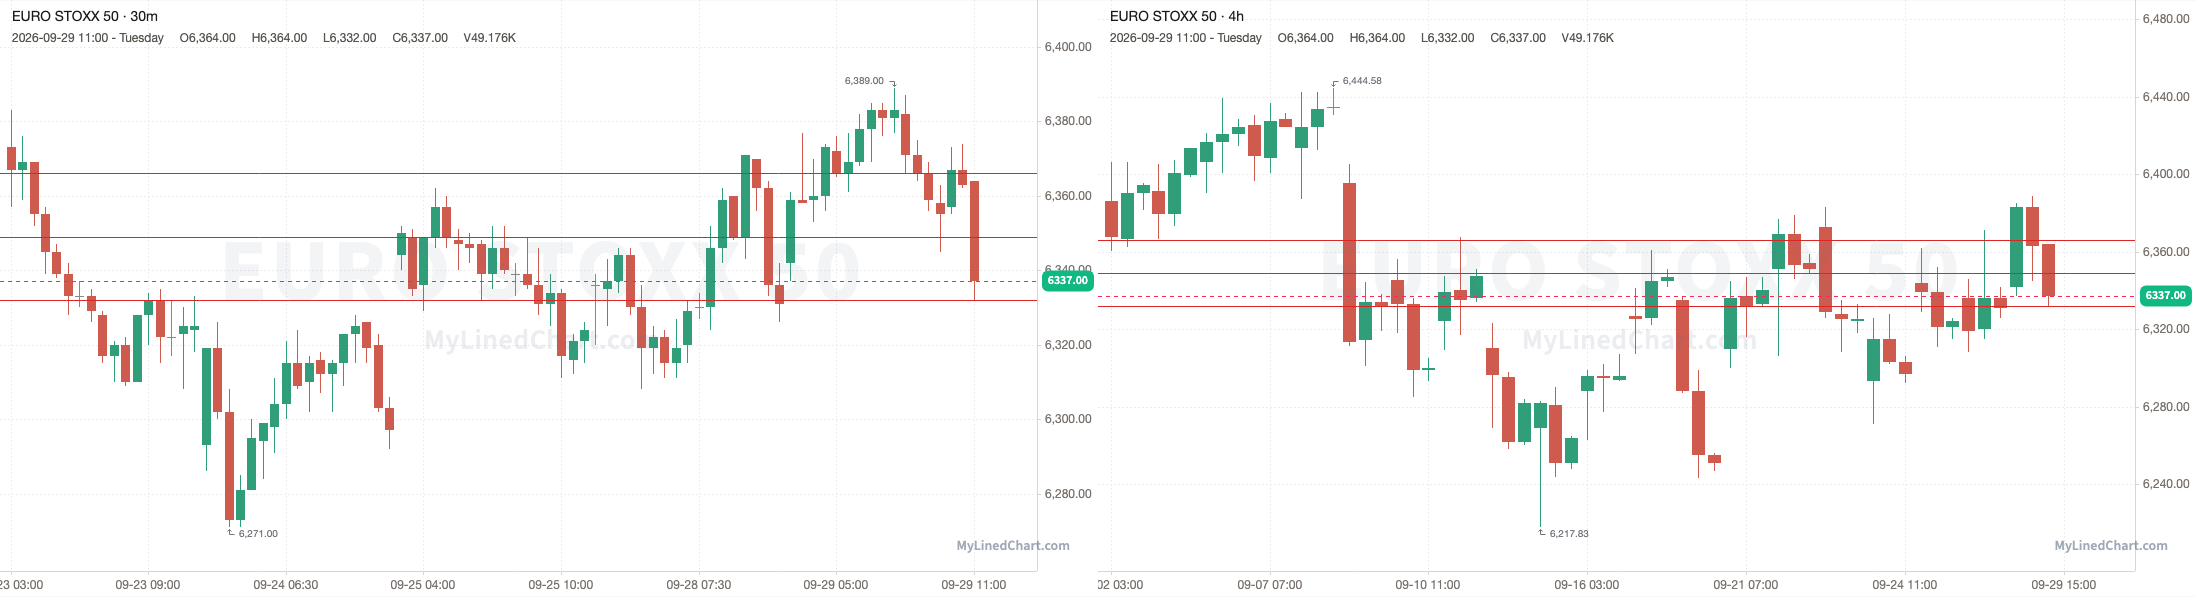
Euro Stoxx 50 opened at 6342, dropped down and tagged the 6332 to 6349 zone and low at 6332, then ended up closing at 6337. Finishing the trading session down 0.08% intraday and up 0.09% overall.
September 29th session levels:
All listed levels: 6332, 6349, 6366
Resistance above: 6332, 6349, 6366
Support below: none
Nearest pivot: 6332
Above 6332 → 6349 next
See the Euro Stoxx 50 trade plan on Little Bird Trading
UK: FTSE 100
A recap of how the September 29th FTSE 100 trading session and levels played out
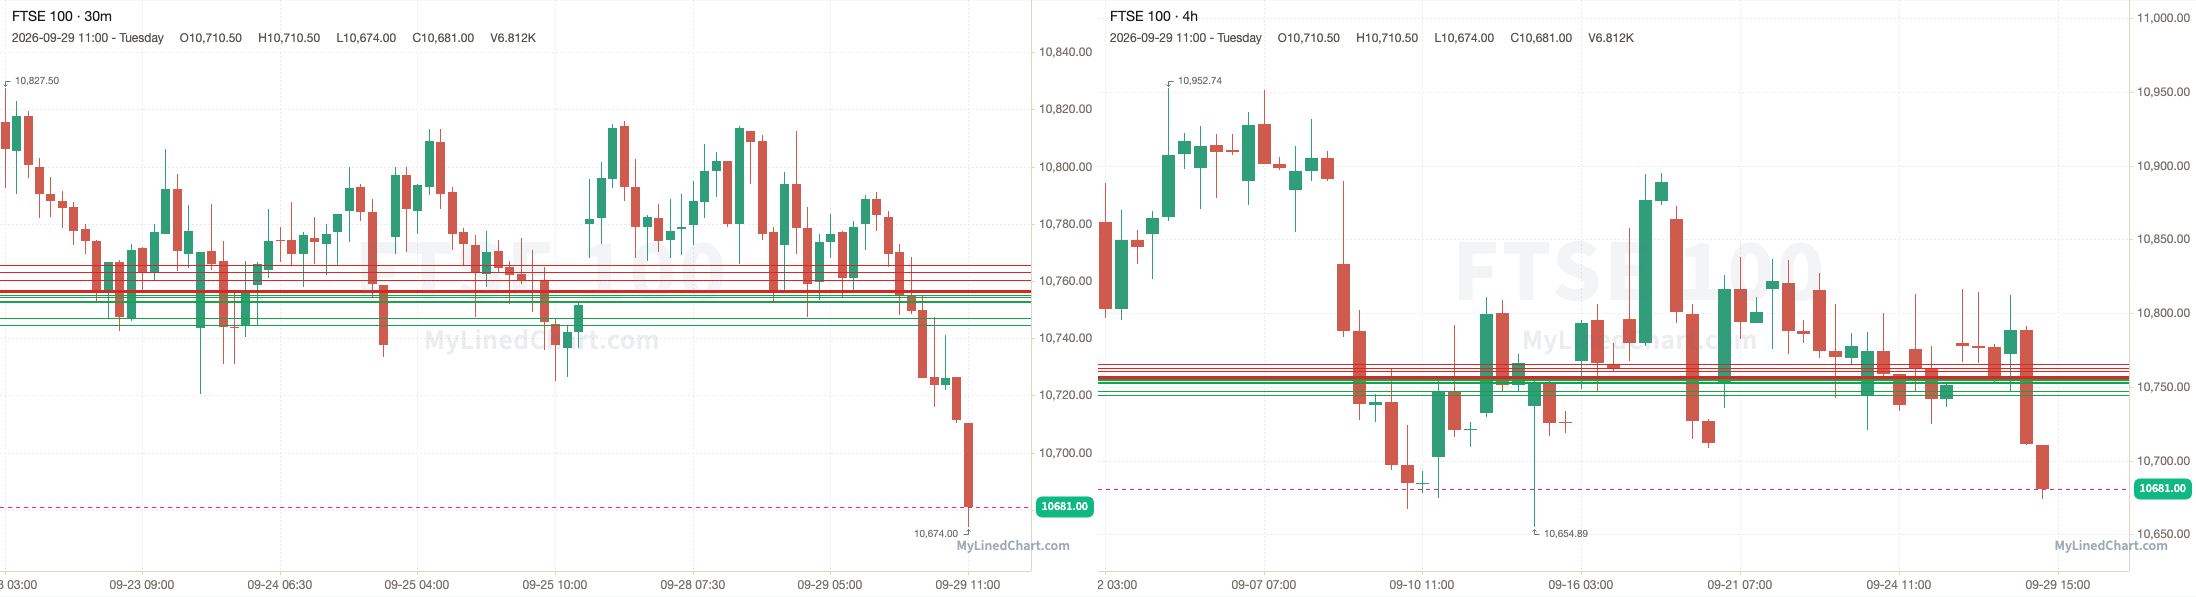
FTSE 100 opened at 10772.50, dropped down and tagged the 10744.50 to 10747 zone and low at 10674, then ended up closing at 10681. Finishing the trading session down 0.85% intraday and down 0.70% overall.
September 29th session levels:
All listed levels: 10744.50, 10747, 10752.50, 10753, 10754.51, 10755.01, 10756, 10756.09, 10756.52, 10757, 10760.50, 10763, 10765.50
Resistance above: 10756.09, 10756.52, 10757, 10760.50, 10763, 10765.50
Support below: 10755.01, 10754.51, 10753, 10752.50, 10747, 10744.50
Nearest pivot: 10756
Above 10756.09 → 10756.52 next
Lose 10755.01 → 10754.51 next
See the FTSE 100 trade plan on Little Bird Trading
France: CAC 40
A recap of how the September 29th CAC 40 trading session and levels played out
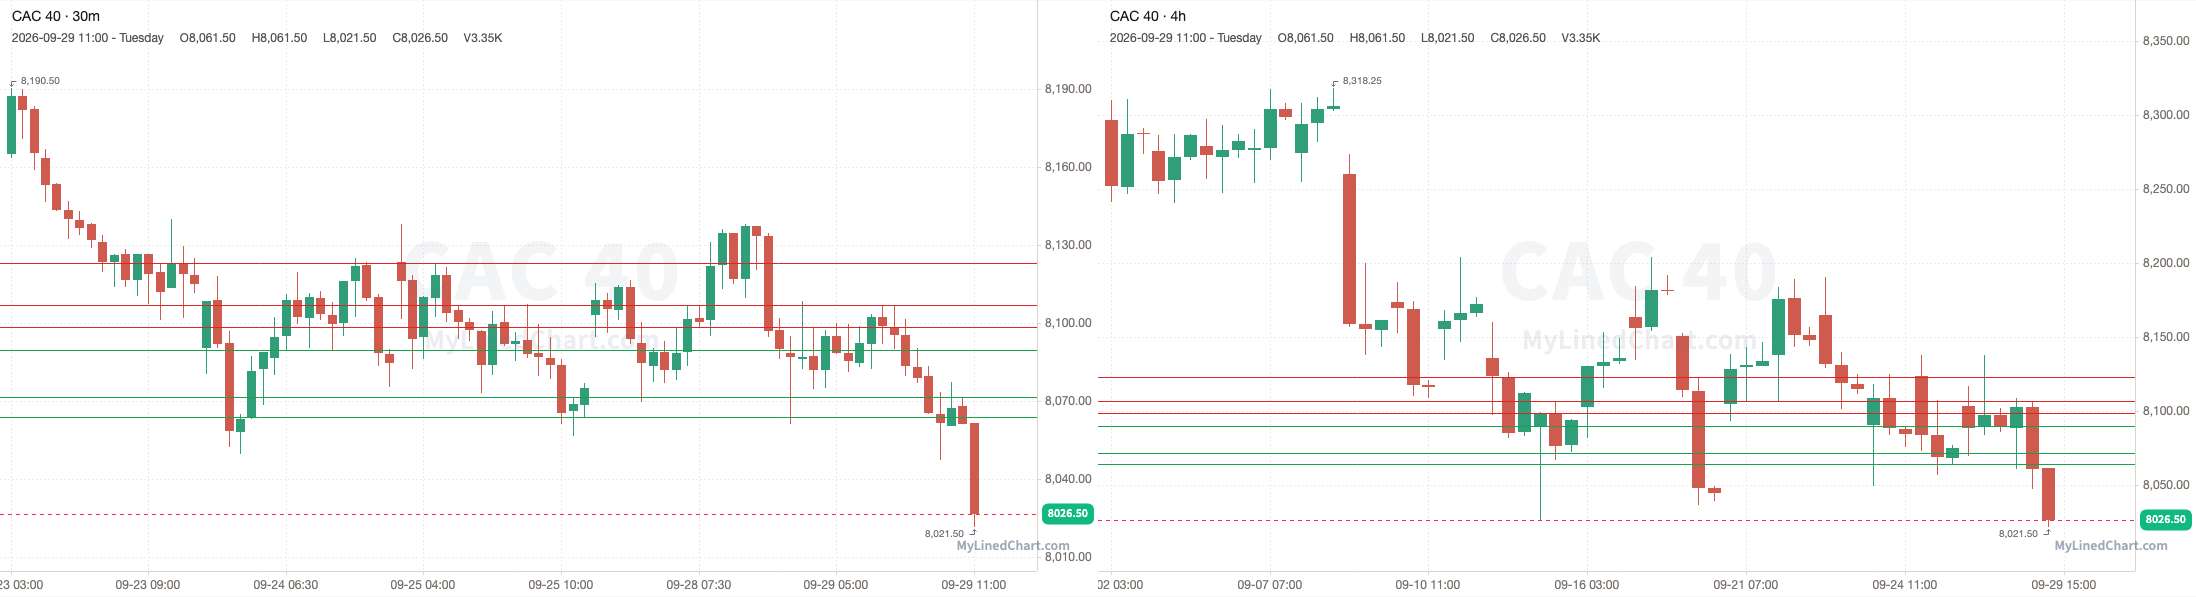
CAC 40 opened at 8088.50, dropped down and tagged the 8064 to 8071.50 zone and low at 8021.50, then ended up closing at 8026.50. Finishing the trading session down 0.77% intraday and down 0.78% overall.
September 29th session levels:
All listed levels: 8064, 8071.50, 8089.50, 8098.50, 8107, 8123
Resistance above: 8098.50, 8107, 8123
Support below: 8089.50, 8071.50, 8064
Nearest pivot: 8089.50
Above 8098.50 → 8107 next
Lose 8089.50 → 8071.50 next
See the CAC 40 trade plan on Little Bird Trading
Spain: IBEX 35
A recap of how the September 29th IBEX 35 trading session and levels played out
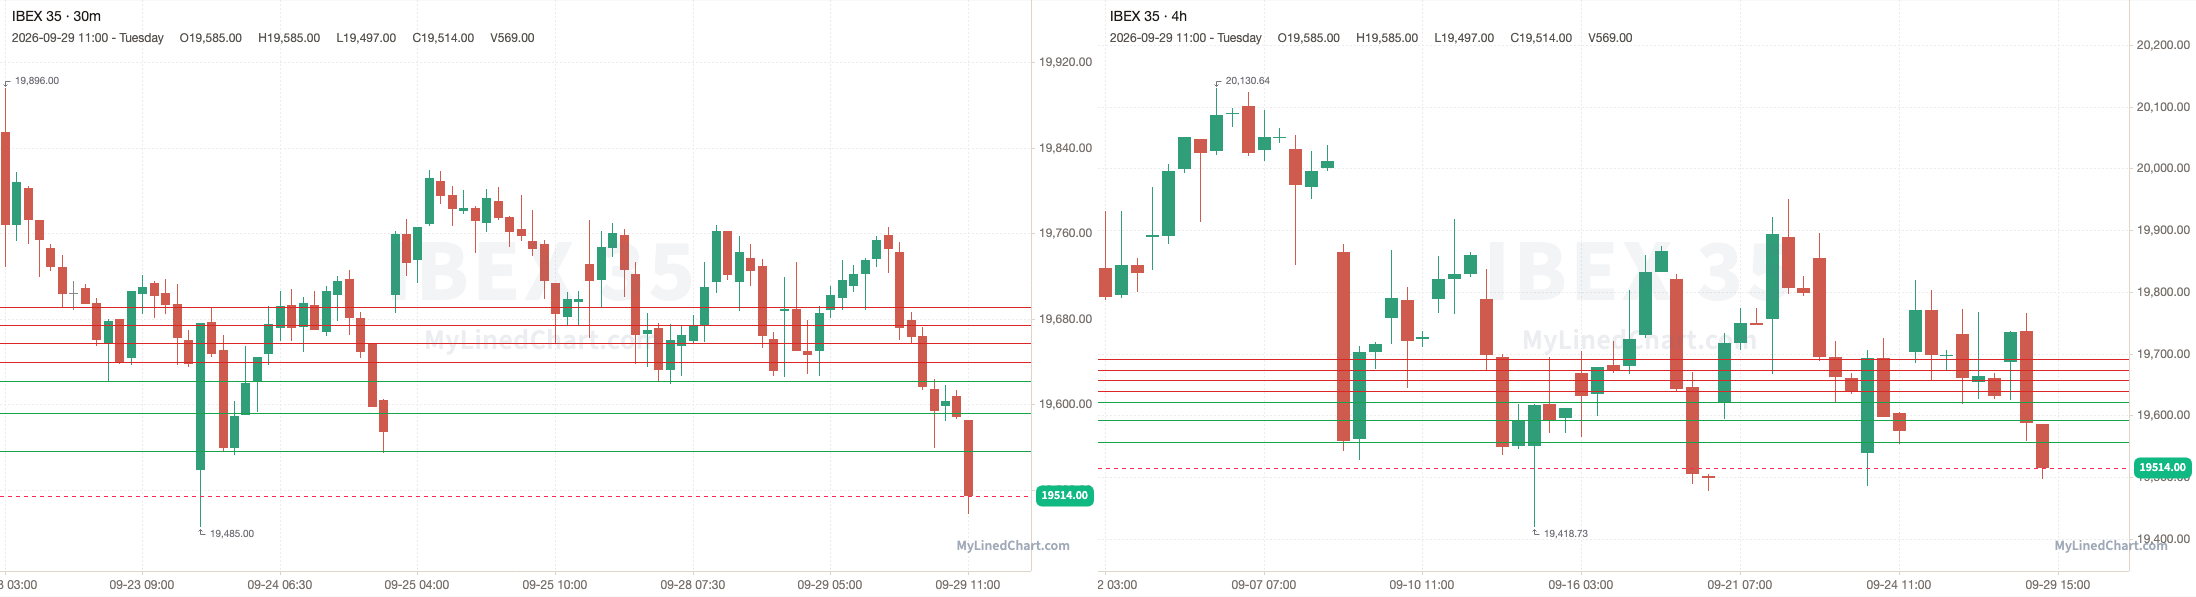
IBEX 35 opened at 19687, dropped down and tagged the 19556 to 19592 zone and low at 19497, then ended up closing at 19514. Finishing the trading session down 0.88% intraday and down 0.60% overall.
September 29th session levels:
All listed levels: 19556, 19592, 19622, 19639, 19657, 19674, 19691
Resistance above: 19639, 19657, 19674, 19691
Support below: 19622, 19592, 19556
Nearest pivot: 19639
Above 19639 → 19657 next
Lose 19622 → 19592 next
See the IBEX 35 trade plan on Little Bird Trading
Italy: FTSE MIB
A recap of how the September 29th FTSE MIB trading session and levels played out
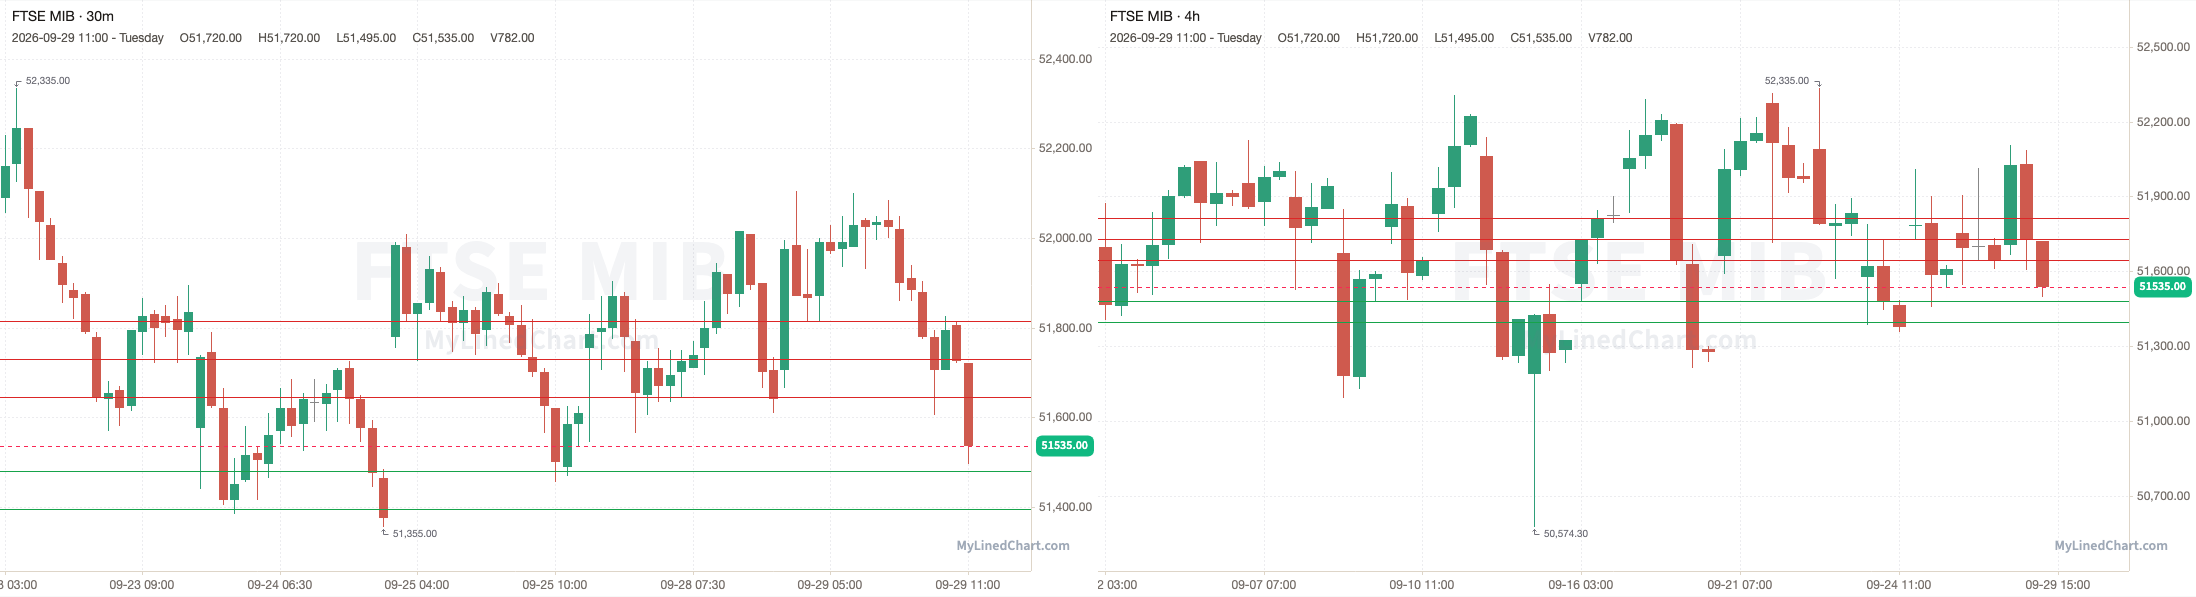
FTSE MIB opened at 51705, dropped down and tagged the 51645 to 51730 zone and low at 51495, then ended up closing at 51535. Finishing the trading session down 0.33% intraday and down 0.20% overall.
September 29th session levels:
All listed levels: 51395, 51480, 51645, 51730, 51815
Resistance above: 51645, 51730, 51815
Support below: 51480, 51395
Nearest pivot: 51645
Above 51645 → 51730 next
Lose 51480 → 51395 next
See the FTSE MIB trade plan on Little Bird Trading
Netherlands: AEX
A recap of how the September 29th AEX trading session and levels played out
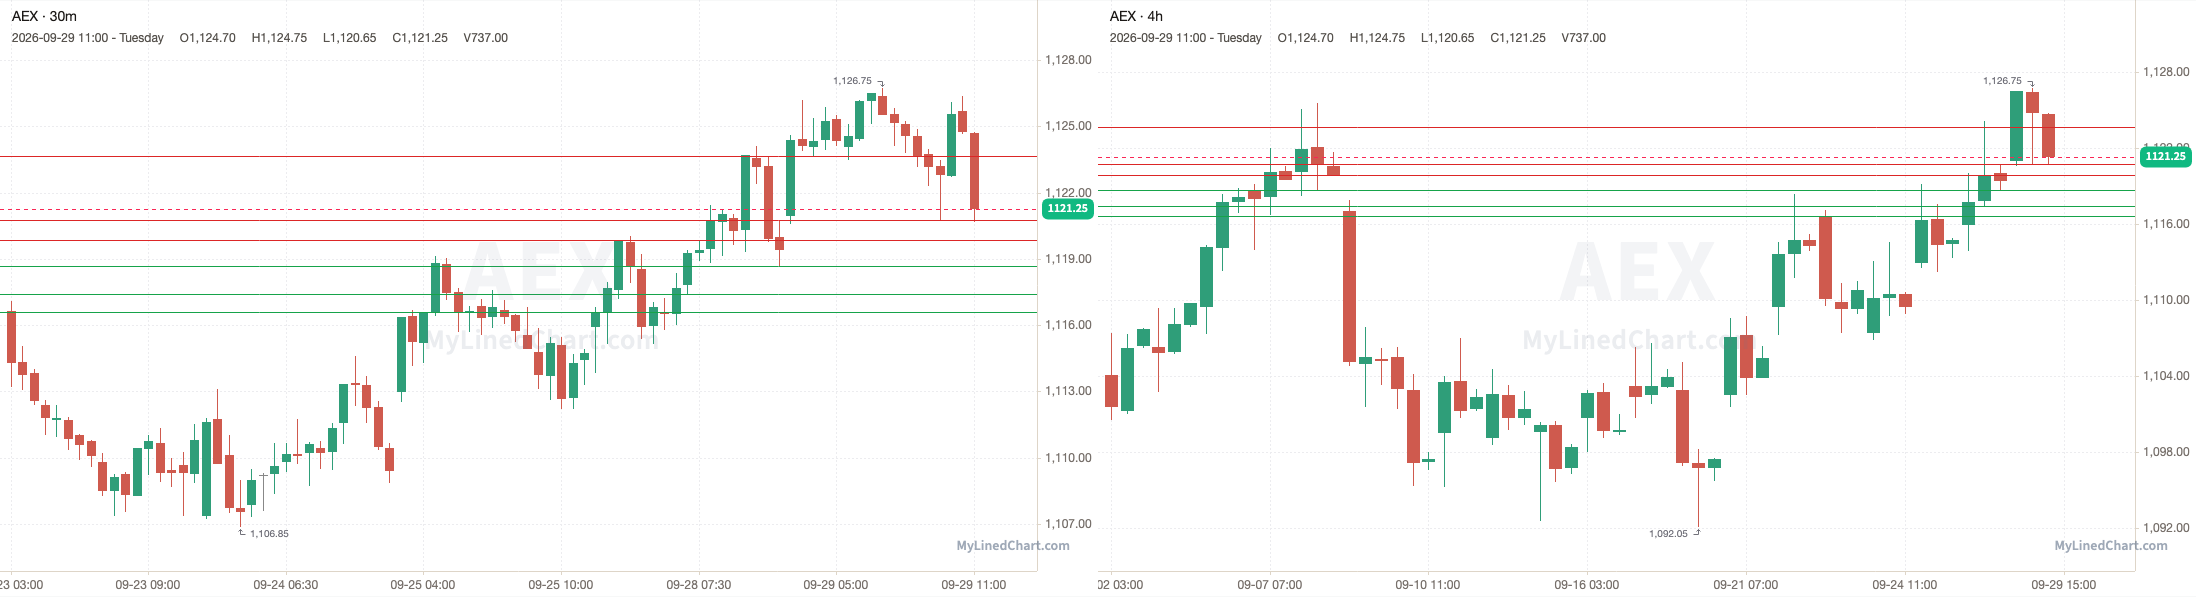
AEX opened at 1120.95, ran up and tagged the 1120.75 to 1123.65 zone and high at 1126.75, then ended up closing at 1121.25. Finishing the trading session up 0.03% intraday and up 0.17% overall.
September 29th session levels:
All listed levels: 1116.60, 1117.40, 1118.70, 1119.85, 1120.75, 1123.65
Resistance above: 1119.85, 1120.75, 1123.65
Support below: 1118.70, 1117.40, 1116.60
Nearest pivot: 1119.85
Above 1119.85 → 1120.75 next
Lose 1118.70 → 1117.40 next
See the AEX trade plan on Little Bird Trading
Sweden: OMXS30
A recap of how the September 29th OMXS30 trading session and levels played out
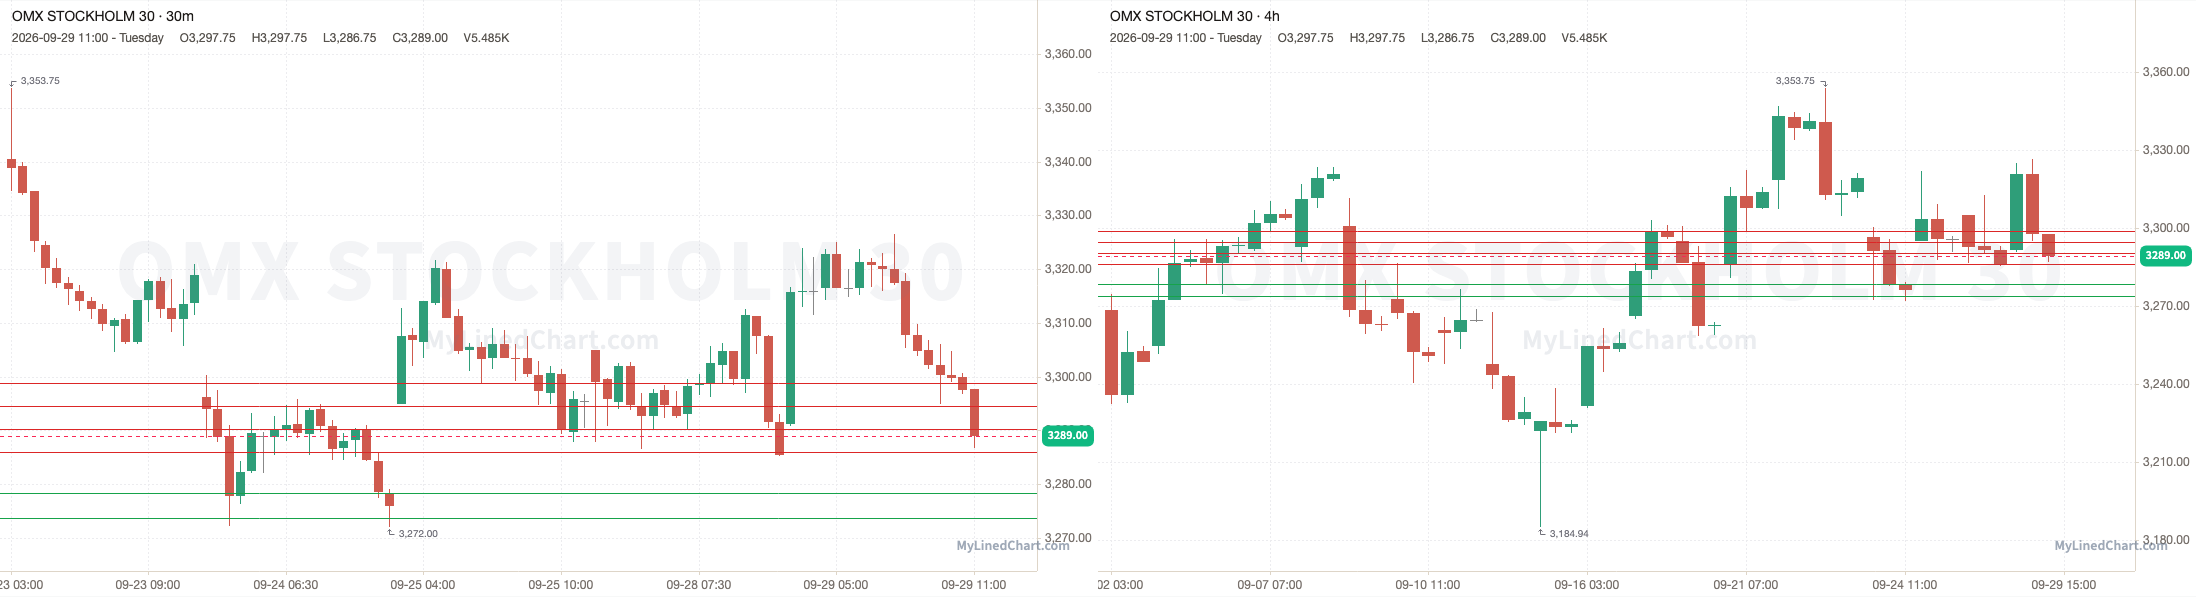
OMXS30 opened at 3291.25, dropped down and tagged the 3290.25 to 3294.50 zone and low at 3286.75, then ended up closing at 3289. Finishing the trading session down 0.07% intraday and up 0.11% overall.
September 29th session levels:
All listed levels: 3273.75, 3278.25, 3286, 3290.25, 3294.50, 3298.75
Resistance above: 3286, 3290.25, 3294.50, 3298.75
Support below: 3278.25, 3273.75
Nearest pivot: 3286
Above 3286 → 3290.25 next
Lose 3278.25 → 3273.75 next
See the OMXS30 trade plan on Little Bird Trading
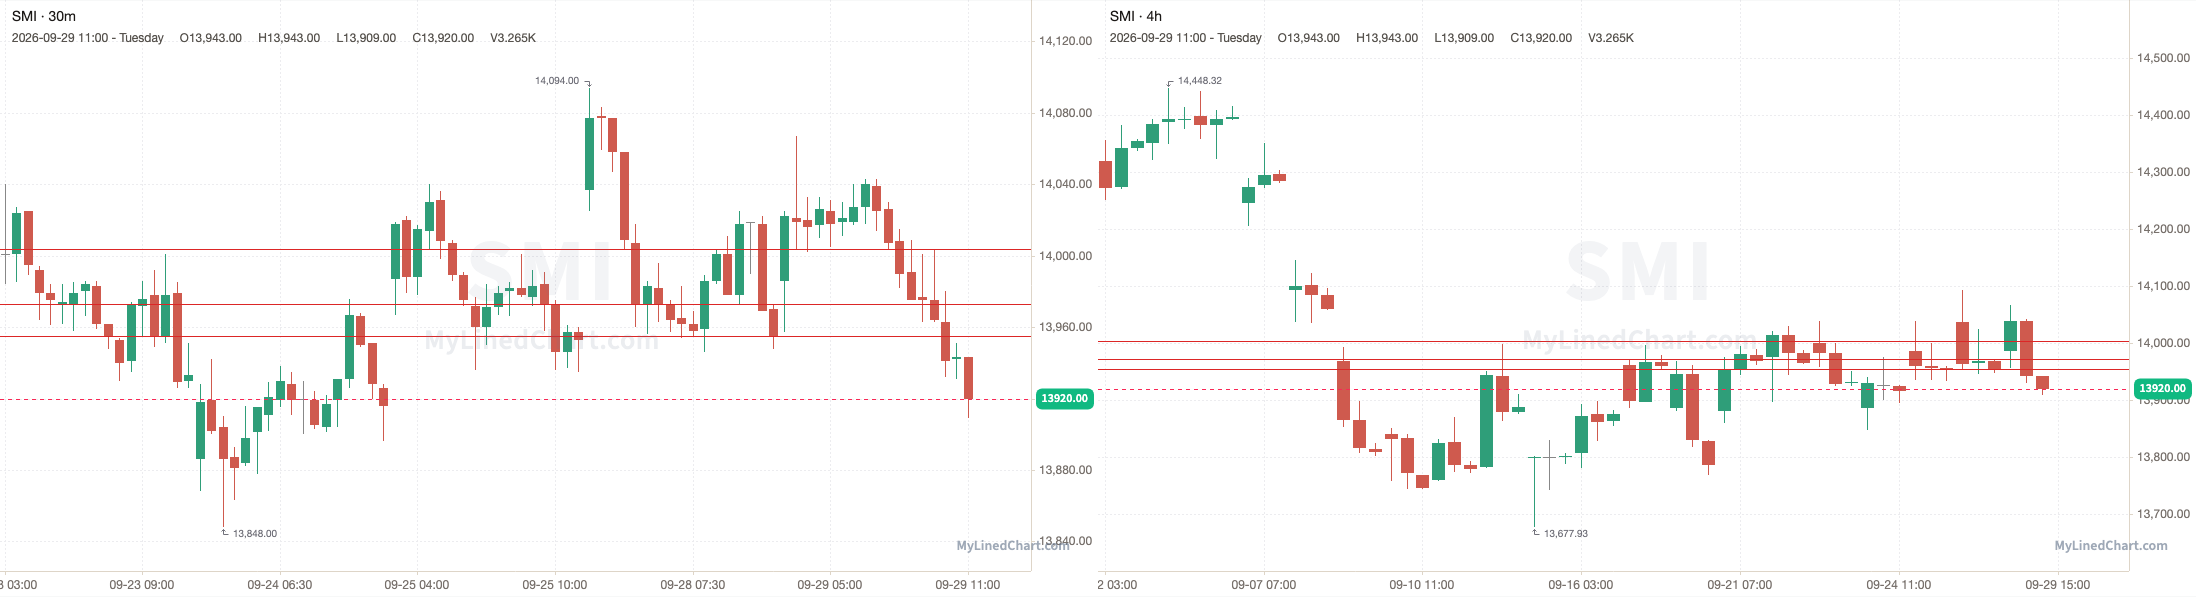
Switzerland: SMI
A recap of how the September 29th SMI trading session and levels played out
SMI opened at 13986, dropped down and tagged the 13955 to 13973 zone and low at 13909, then ended up closing at 13920. Finishing the trading session down 0.47% intraday and down 0.25% overall.
September 29th session levels:
All listed levels: 13955, 13973, 14004
Resistance above: 13973, 14004
Support below: none
Nearest pivot: 13955
Above 13973 → 14004 next
See the SMI trade plan on Little Bird Trading
Latin America
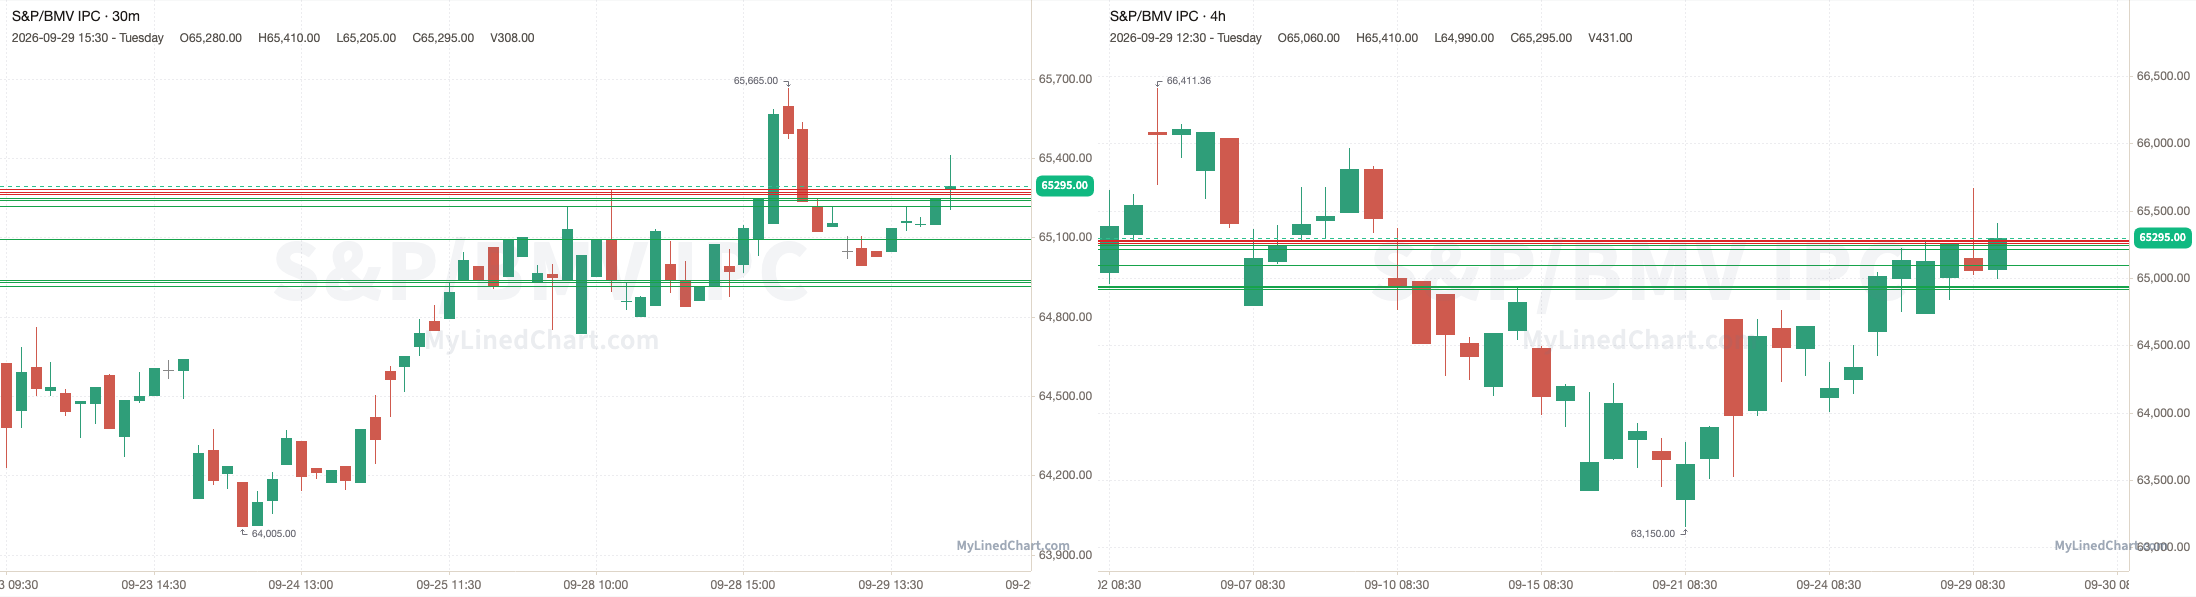
Mexico: S&P/BMV IPC
A recap of how the September 29th S&P/BMV IPC trading session and levels played out
S&P/BMV IPC opened at 65150, ran up and tagged the 65273 to 65282 zone and high at 65665, then ended up closing at 65295. Finishing the trading session up 0.22% intraday and up 0.07% overall.
September 29th session levels:
All listed levels: 64915, 64930, 64940, 65095, 65218, 65243, 65248, 65263, 65273, 65282
Resistance above: 65263, 65273, 65282
Support below: 65248, 65243, 65218, 65095, 64940, 64930, 64915
Nearest pivot: 65248
Above 65263 → 65273 next
Lose 65248 → 65243 next
See the S&P/BMV IPC trade plan on Little Bird Trading
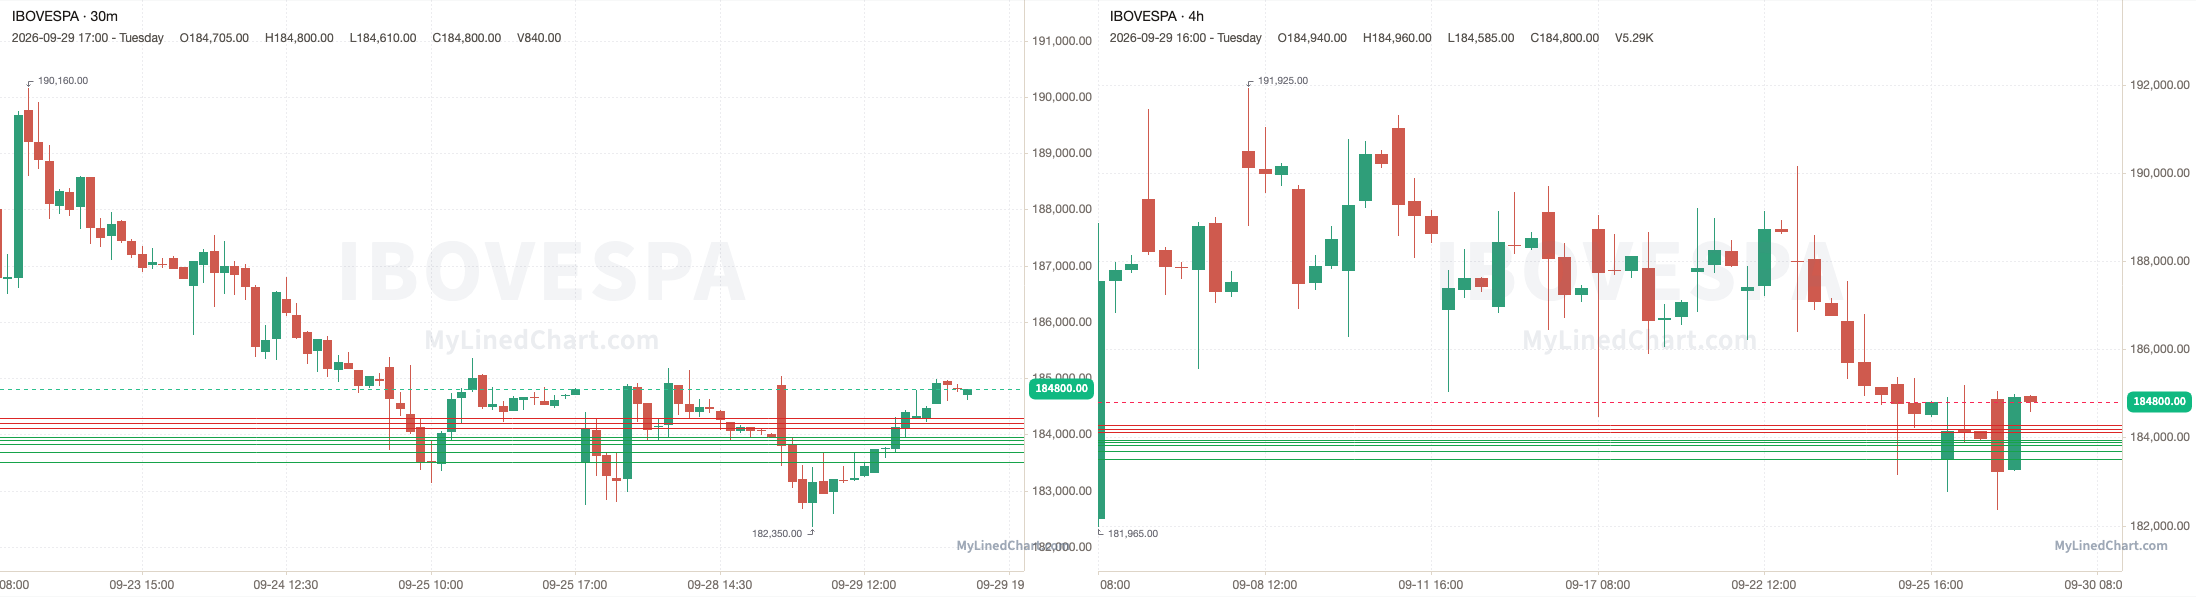
Brazil: Ibovespa
A recap of how the September 29th Ibovespa trading session and levels played out
Ibovespa opened at 184880, dropped down and tagged the 183510 to 183690 zone and low at 182350, then ended up closing at 184800. Finishing the trading session down 0.04% intraday and up 0.46% overall.
September 29th session levels:
All listed levels: 183510, 183690, 183835, 183895, 183950, 184110, 184195, 184285
Resistance above: 184110, 184195, 184285
Support below: 183950, 183895, 183835, 183690, 183510
Nearest pivot: 183950
Above 184110 → 184195 next
Lose 183950 → 183895 next
See the Ibovespa trade plan on Little Bird Trading
Get each market's levels in real time as they're posted. Sign up on Little Bird Trading.
Pro: next-session levels for the markets you trade, on Little Bird Trading.
Disclaimer: Little Bird Trading and any of its associations may or may not, whether long or short, have a position in any instruments. Not investment advice. Provided for informational purposes only. Not a recommendation or endorsement. Not registered or licensed. Model portfolios are property of their respective owners. All data is sourced from publicly available information. No guarantee is being made or offered. Not responsible for financial loss or ruin. Little Bird Trading may earn a commission if you purchase through links on the site.
Day Trade Levels for the September 30th Trading Session:
Enjoying this content?
Subscribe on Substack