

SPY, ES, QQQ, NQ, SPI & NIFTY 50: Sept 14–18 week in review
US, Australia and India day trade levels with resistance, pivot & support levels | MyLinedChart: Turn your technical analysis into trading rules. Draw your levels, export entire chart as XLSX/JSON/CSV, and let your AI codify it into rules you reuse
See the latest daily SPY, ES, QQQ & NQ levels, posted the evening before the next day's session.
Latest reports: US day trade levels | ASX 200 & SPI levels | NIFTY 50 levels
MyLinedChart turns your technical analysis into trading rules. Draw your levels, export your entire chart to XLSX, and turn your rules into trades. Or, have Claude, Codex, or Cursor do the work for you.
A mixed week across the US, Australia and India: 4 of 6 finished higher (SPY +0.35%, ES +0.68%, QQQ +2.55%, NQ +2.63%, SPI -0.45%, NIFTY 50 -0.78%), with the week's low on Wednesday, September 16.
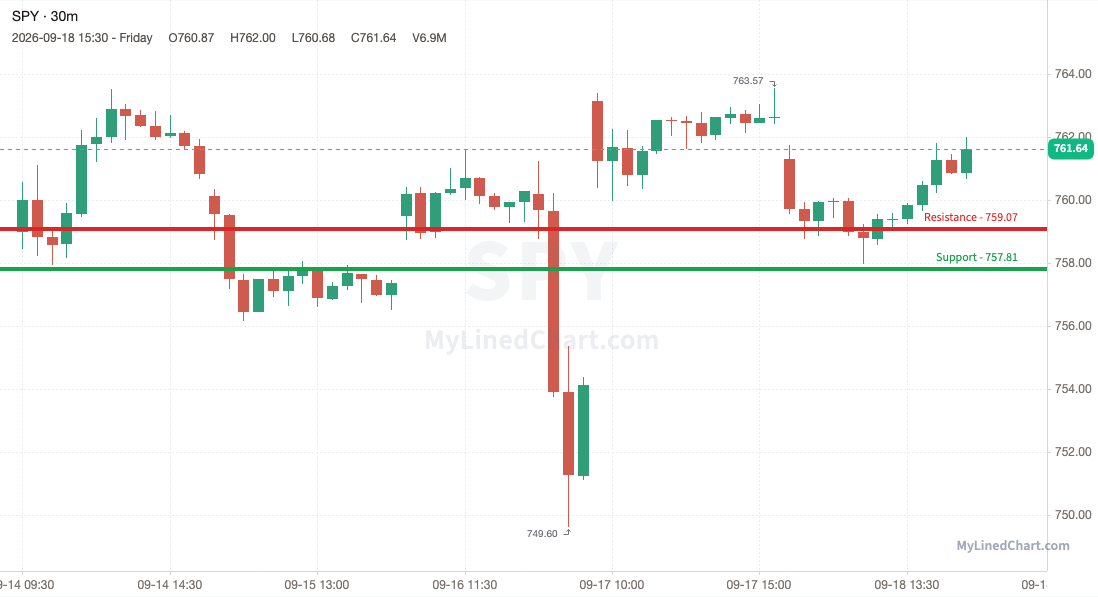
SPY (S&P 500 ETF) +0.35% 758.99 → 761.64
A midweek shakeout dragged SPY down to 749.60 beneath 757.81 before it recovered the line and settled at 761.64, at the top of its weekly range.
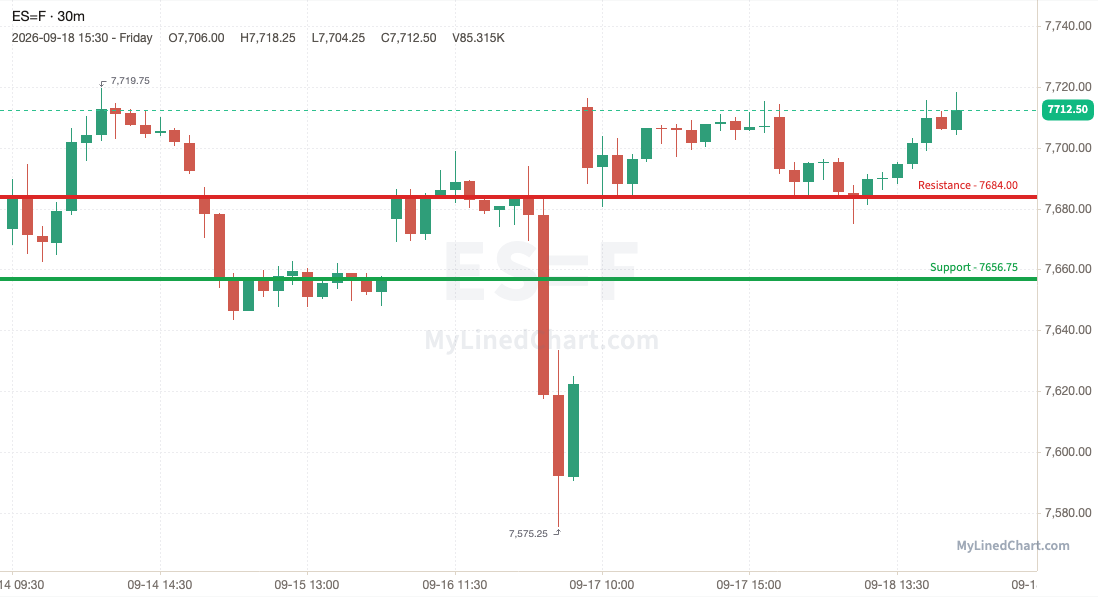
ES (E-mini S&P 500 futures) +0.68% 7,673.25 → 7,725.50
ES dipped under 7,656.75 to 7,575.25, then bought back up to close the week at 7,725.50, near the week's high.
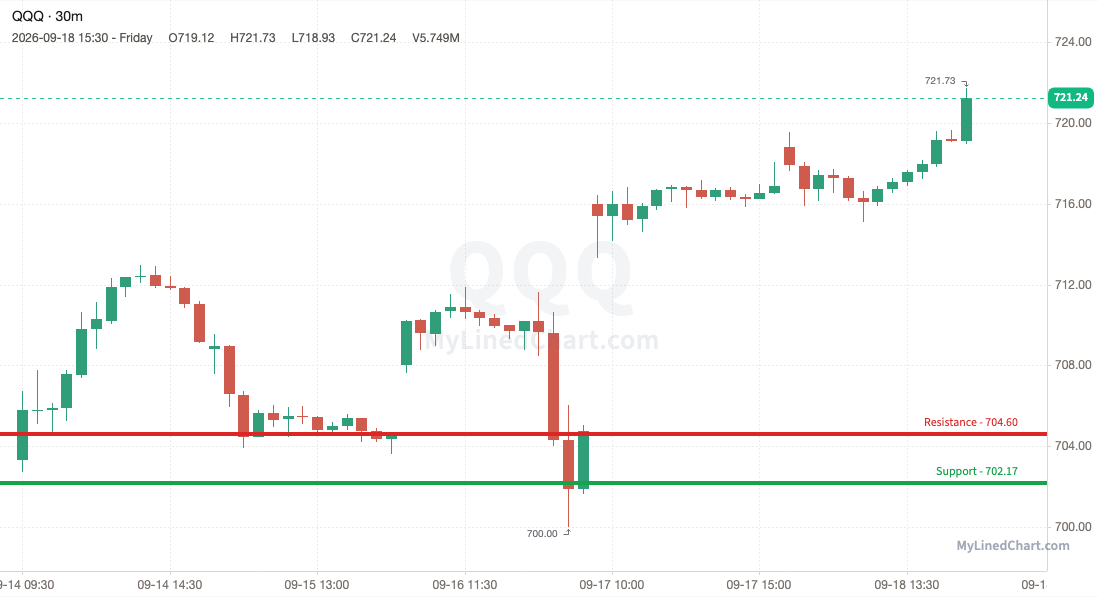
QQQ (Nasdaq 100 ETF) +2.55% 703.33 → 721.24
Buyers had to work for it: QQQ flushed to 700.00, below the 702.17 support, then reclaimed the level and closed at 721.24, just off the highs.
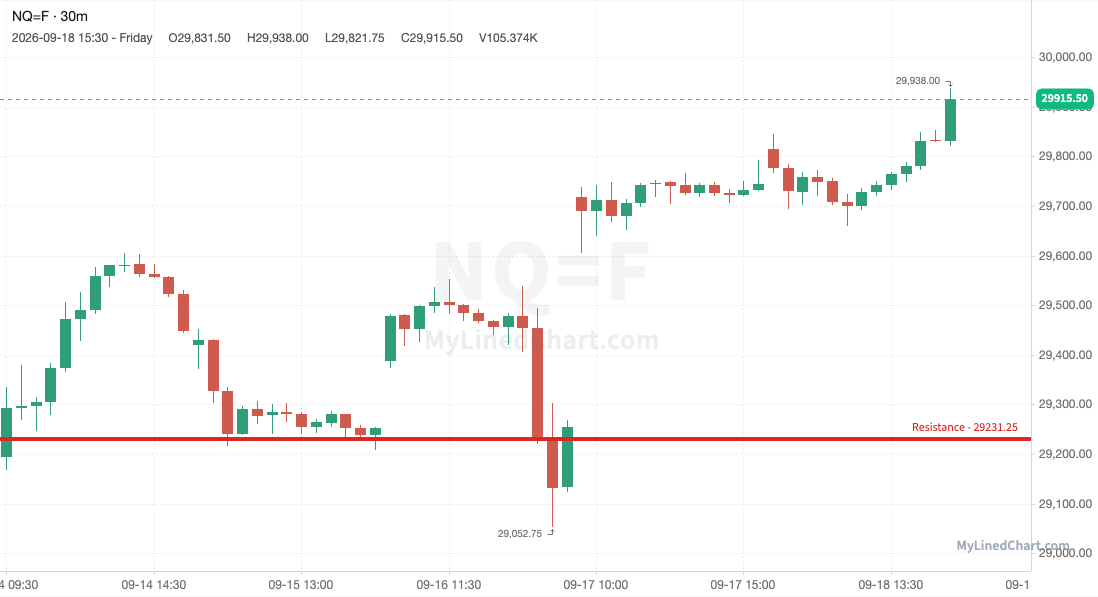
NQ (E-mini Nasdaq 100 futures) +2.63% 29,193.75 → 29,960.25
NQ opened the week under every level published and closed at 29,960.25, at the top of its weekly range.
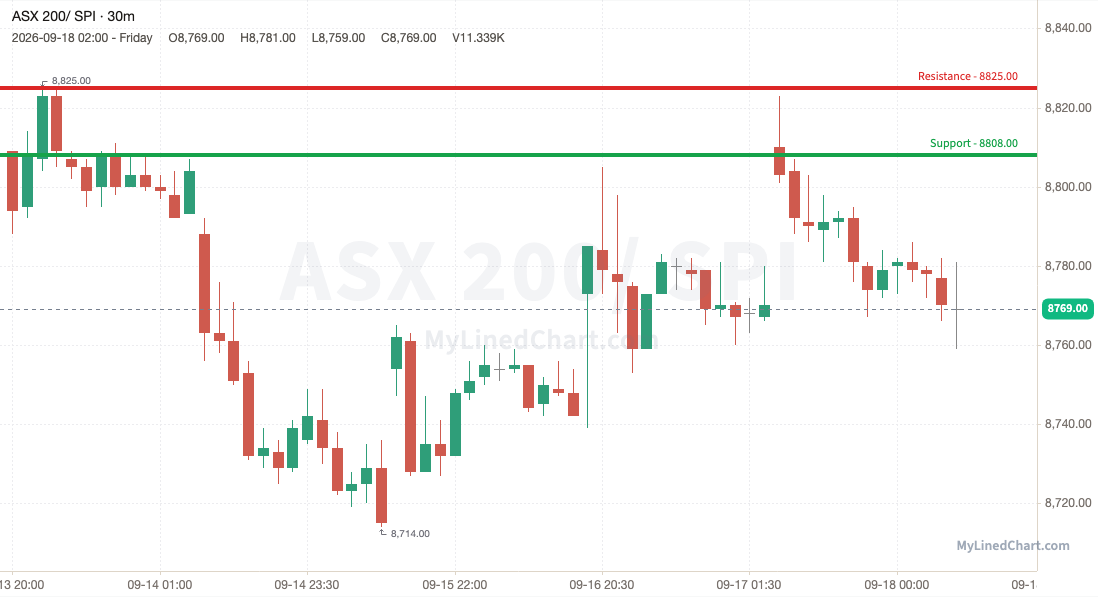
SPI (ASX 200 SPI 200 futures) -0.45% 8,809.00 → 8,769.00
SPI broke the 8,808.00 support and couldn't get back above it, closing at 8,769.00, mid-range for the week.
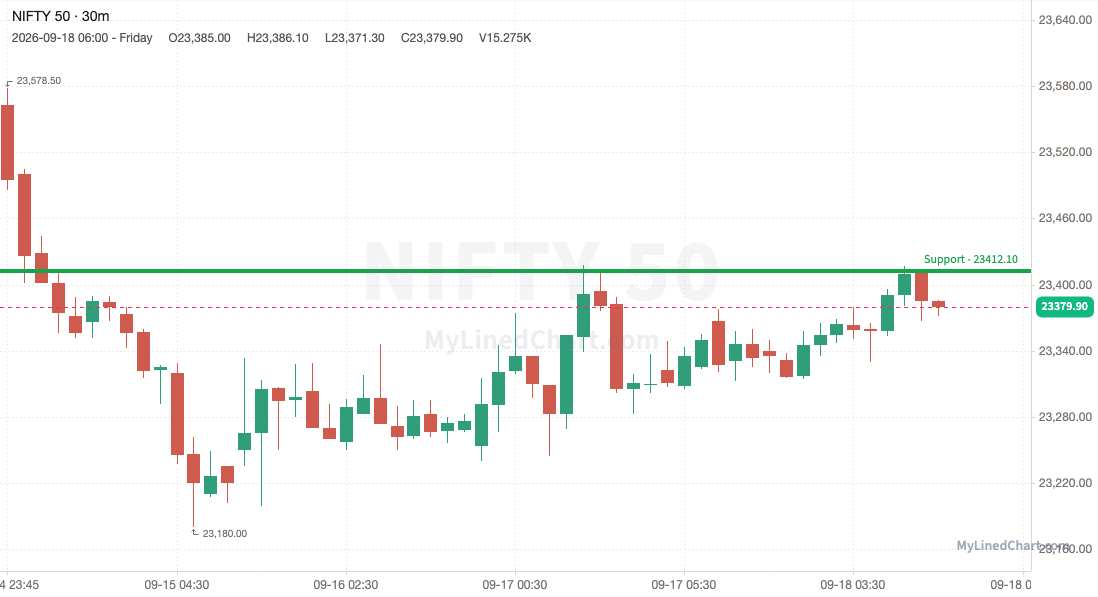
NIFTY 50 (NIFTY 50 futures) -0.78% 23,562.60 → 23,379.90
NIFTY 50 lost 23,412.10 and stayed under it, ending the week at 23,379.90, in the middle of its range.
Disclaimer: Little Bird Trading and any of its associations may or may not, whether long or short, have a position in any instruments. Not investment advice. Provided for informational purposes only. Not a recommendation or endorsement. Not registered or licensed. All data is sourced from publicly available information. No guarantee is being made or offered. Not responsible for financial loss or ruin.
Enjoying this content?
Subscribe on Substack