

SPY Support and Resistance for Oct 13: Highest Volume Levels and Pivots for Day Traders
Support, resistance and pivot levels for SPY, ES, QQQ, NQ and 19 stock markets across Asia, Europe and the Americas ahead of the October 13th session, plus how the last session's levels traded.
Little Bird Trading is in 15+ languages. View this report in:
Deutsch · 日本語 · Español (España) · Español · 한국어 · 简体中文 · हिन्दी · Français · Português (Brasil) · Português (Portugal) · 繁體中文 · Italiano · Nederlands · Svenska

MyLinedChart
✅ Draw your levels once
✅ Export them as XLSX JSON or CSV
✅ Let your AI turn them into trading rules
Looking for a pro to build your trading workflows? Reach out on Upwork.
Get each market's levels about 1 hour after the close with Pro on Little Bird Trading.
US
A recap of how the October 12th trading session and levels played out
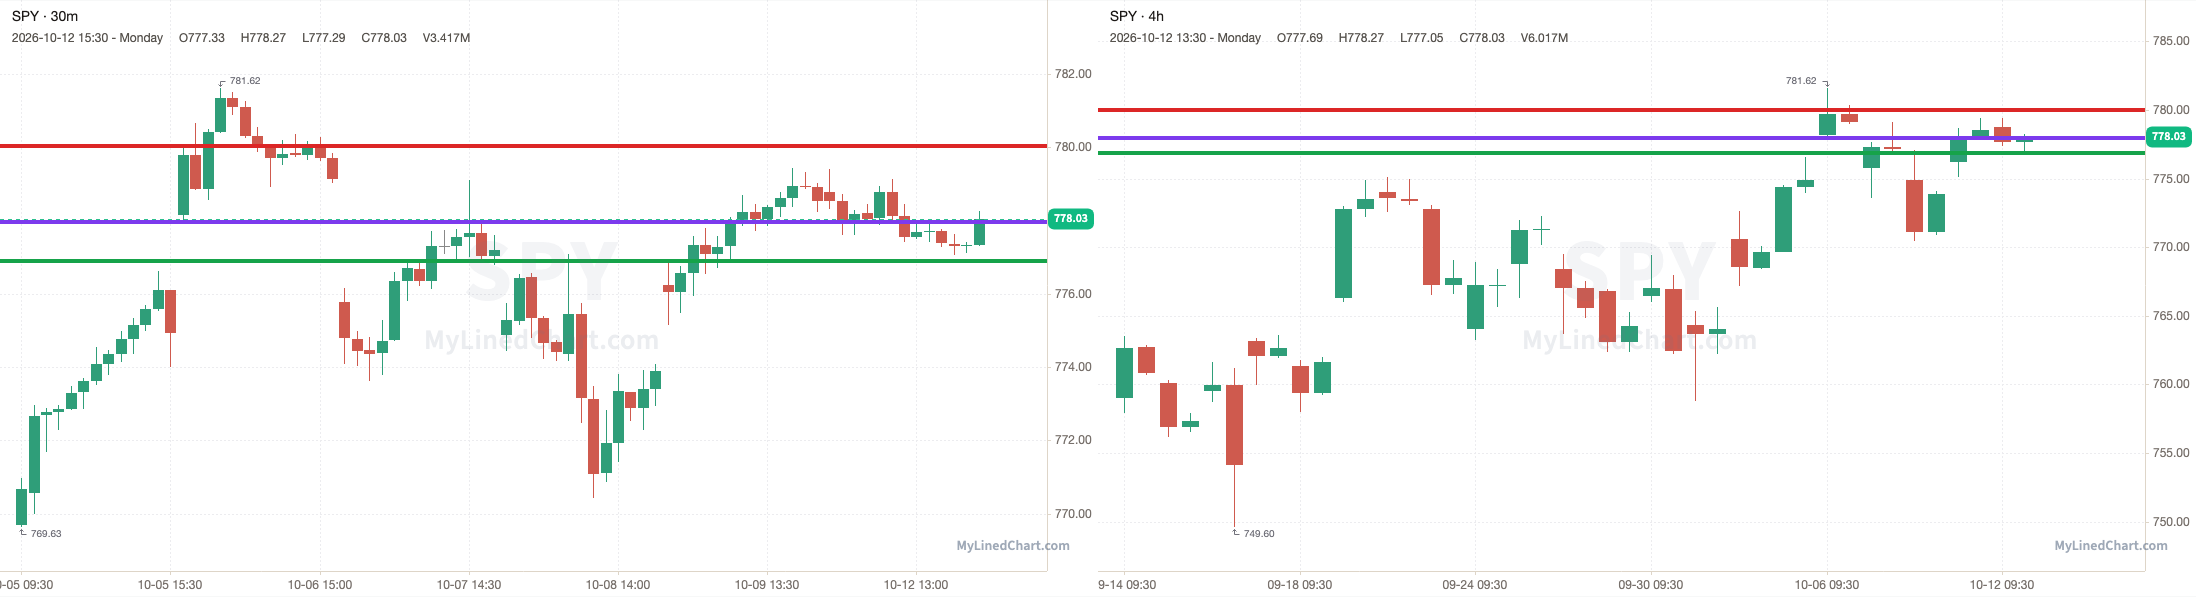
SPY opened at 778.78, broke below the 777.97 pivot and dropped to a low of 777.05, then ended up closing at 778.03. SPY finished down 0.10% intraday and down 0.06% overall.
October 12th session levels:
All listed levels: 776.90, 777.97, 780.02
Resistance above: 780.02
Support below: 777.97, 776.90
Nearest pivot: 777.97
Above 780.02 → open air
Lose 777.97 → 776.90 next
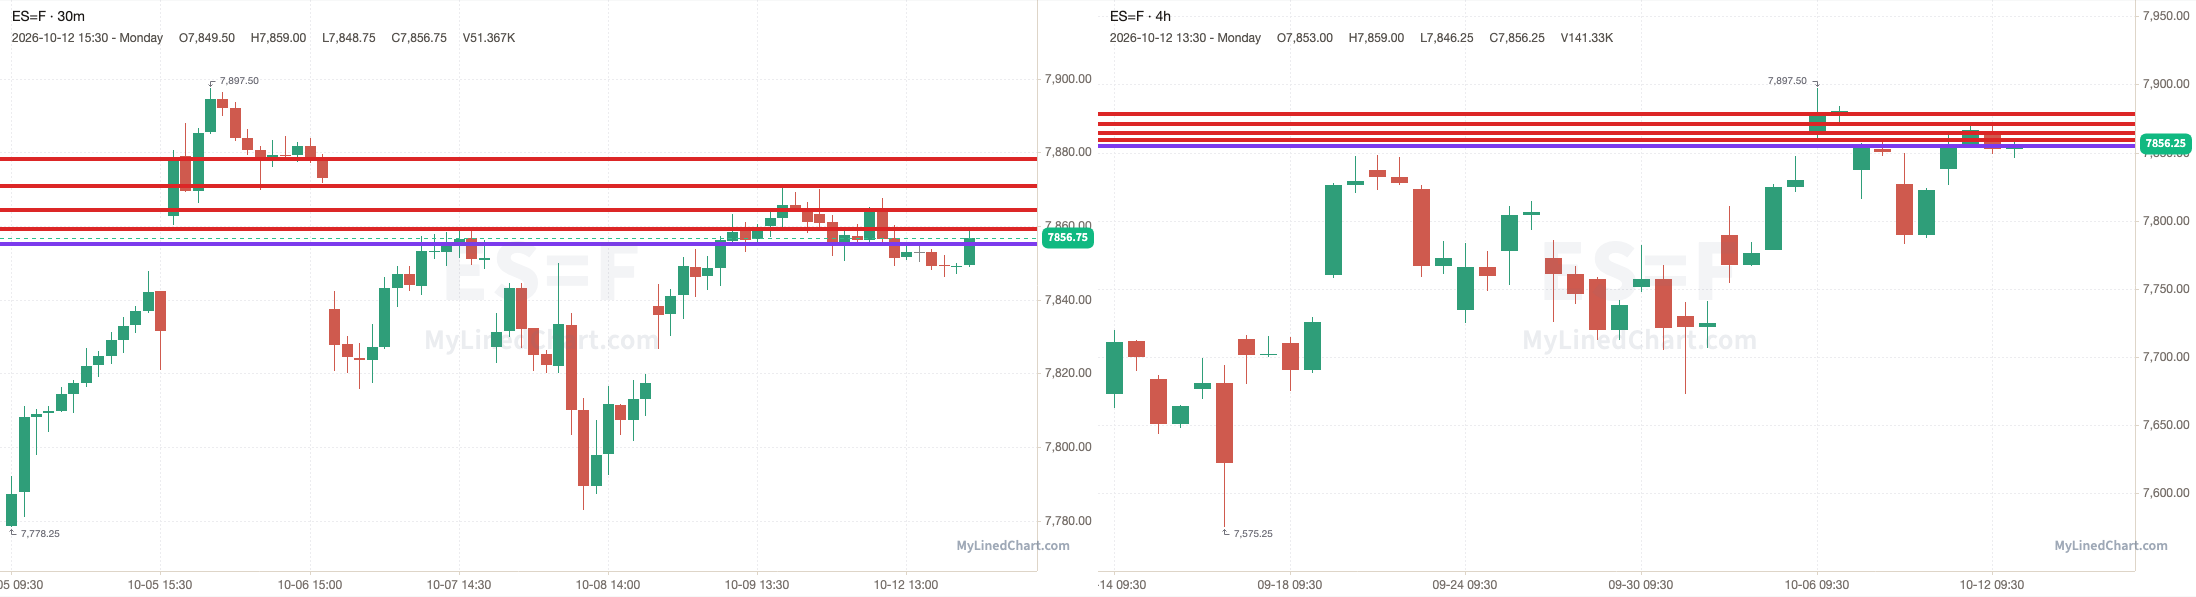
ES opened at 7863.25, popped above the 7864.25 pivot to a high of 7870, then lost it and ran through every support level down to 7855, and kept going to a low of 7846.25, then ended up closing at 7856.25. ES finished down 0.09% intraday and down 0.13% overall.
October 12th session levels:
All listed levels: 7855, 7859.25, 7864.25, 7870.75, 7878.25
Resistance above: 7870.75, 7878.25
Support below: 7864.25, 7859.25, 7855
Nearest pivot: 7864.25
Above 7870.75 → 7878.25 next
Lose 7864.25 → 7859.25 next
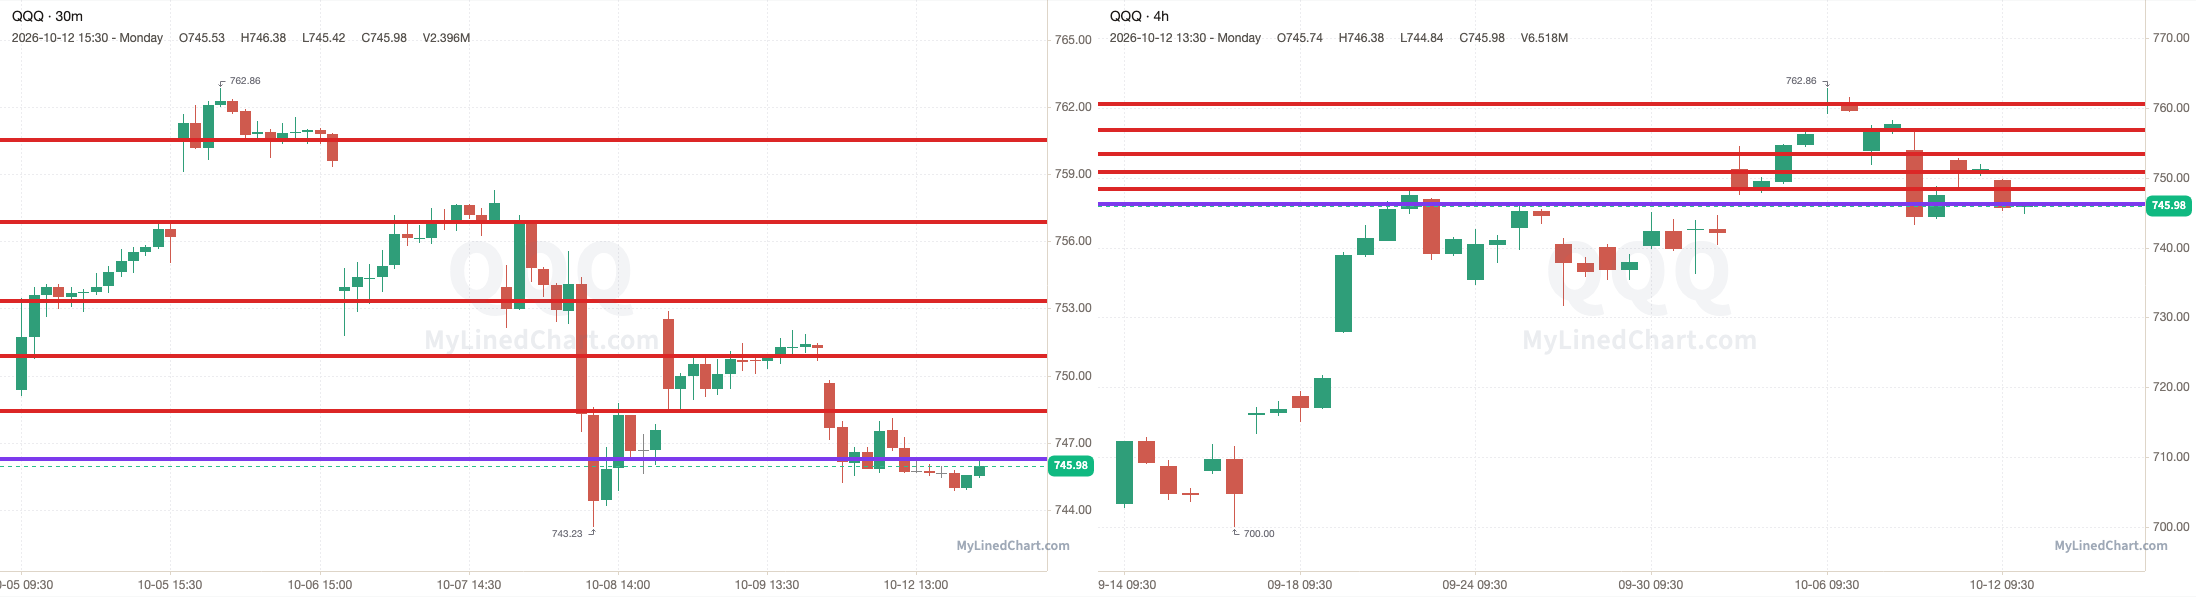
QQQ opened at 749.69, stayed under the 750.87 pivot and ran through every support level down to 746.26, and kept going to a low of 744.84, then ended up closing at 745.98. QQQ finished down 0.49% intraday and down 0.70% overall.
October 12th session levels:
All listed levels: 746.26, 748.40, 750.87, 753.34, 756.88, 760.51
Resistance above: 753.34, 756.88, 760.51
Support below: 750.87, 748.40, 746.26
Nearest pivot: 750.87
Above 753.34 → 756.88 next
Lose 750.87 → 748.40 next
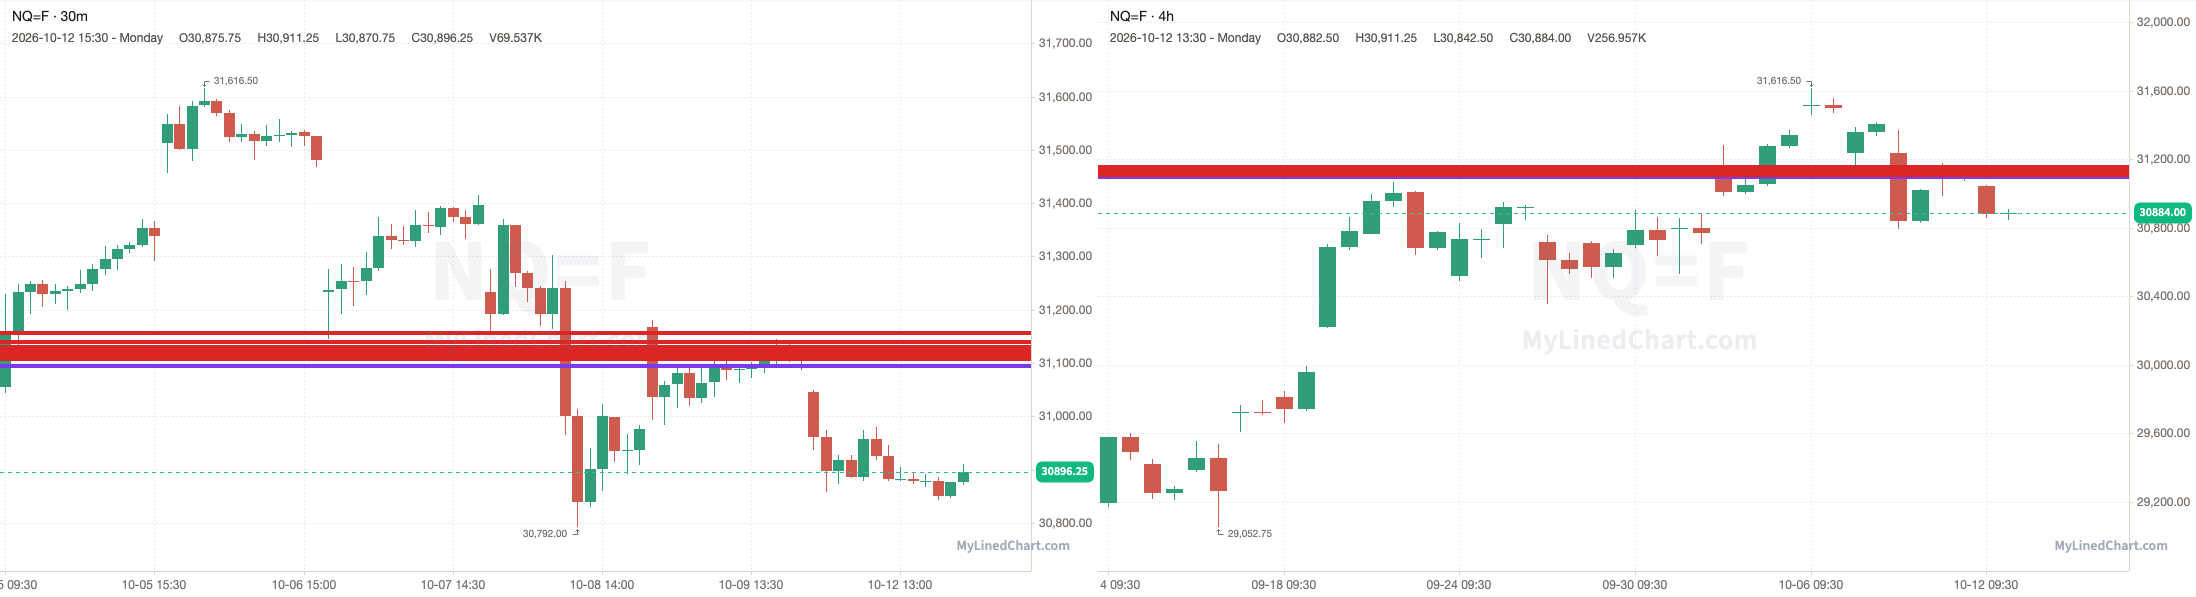
NQ opened at 31045, under the 31122.25 pivot and every level in the plan, and never traded back up to them, with a high of 31049 and a low of 30842.50, then ended up closing at 30884. NQ finished down 0.52% intraday and down 0.77% overall.
October 12th session levels:
All listed levels: 31095, 31108, 31113, 31119.50, 31122.25, 31129.75, 31139.75, 31156.25
Resistance above: 31129.75, 31139.75, 31156.25
Support below: 31122.25, 31119.50, 31113, 31108, 31095
Nearest pivot: 31122.25
Above 31129.75 → 31139.75 next
Lose 31122.25 → 31119.50 next
See the SPY, ES, QQQ & NQ levels on Little Bird Trading
Asia
Japan: Nikkei 225
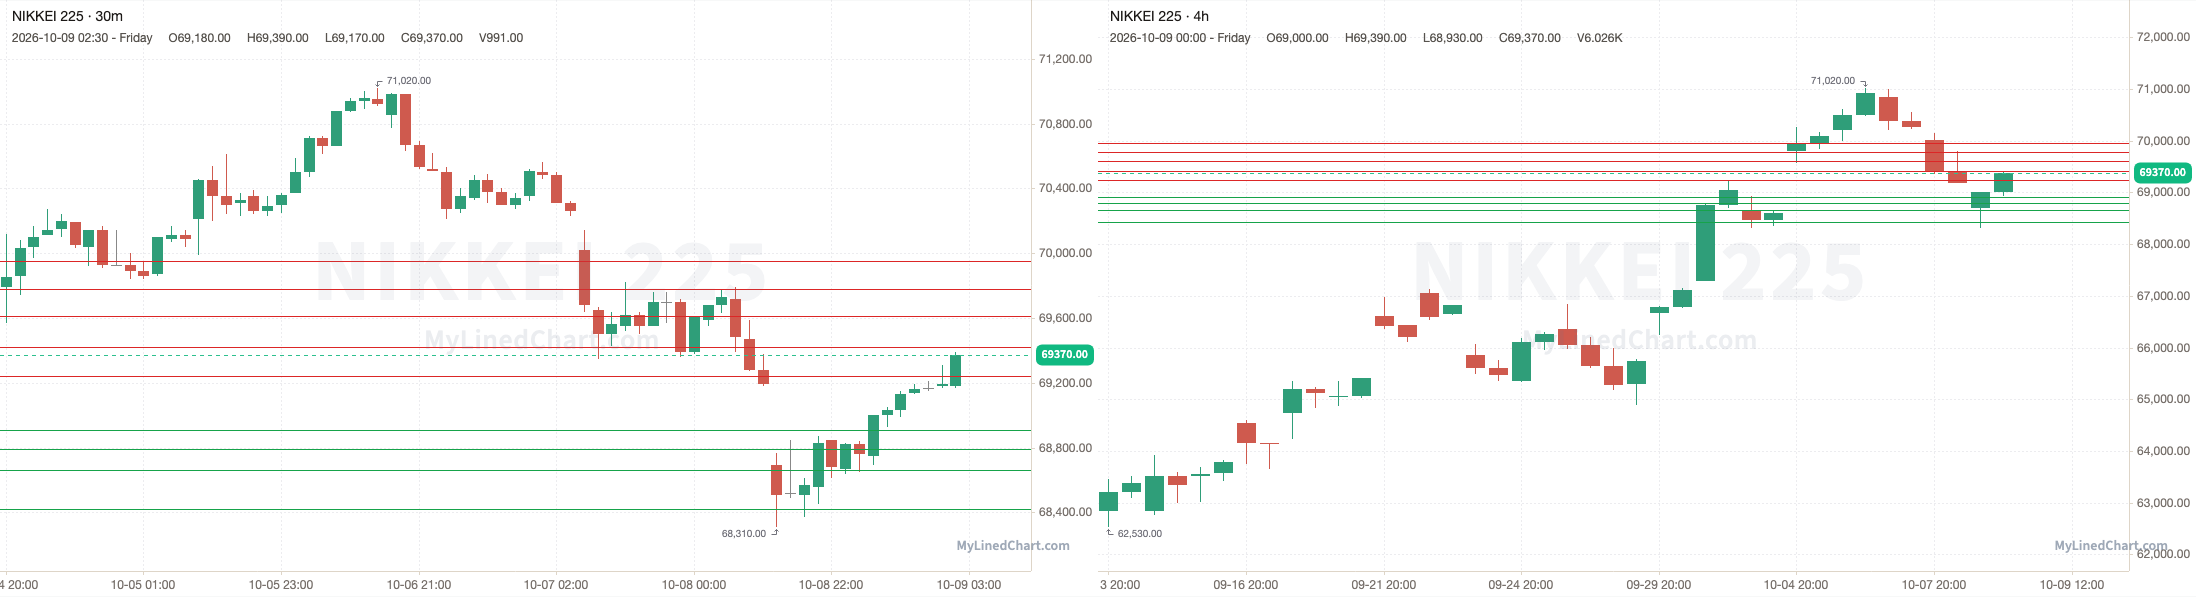
A recap of how the October 9th Nikkei 225 trading session and levels played out
Nikkei 225 opened at 68690, broke above the 69240 pivot and pushed to a high of 69390, then ended up closing at 69370. Finishing the trading session up 0.99% intraday.
October 9th session levels:
All listed levels: 68420, 68660, 68790, 68910, 69240, 69420, 69610, 69780, 69950
Resistance above: 69240, 69420, 69610, 69780, 69950
Support below: 68910, 68790, 68660, 68420
Nearest pivot: 69240
Above 69240 → 69420 next
Lose 68910 → 68790 next
See the Nikkei 225 levels on Little Bird Trading
Korea: KOSPI 200
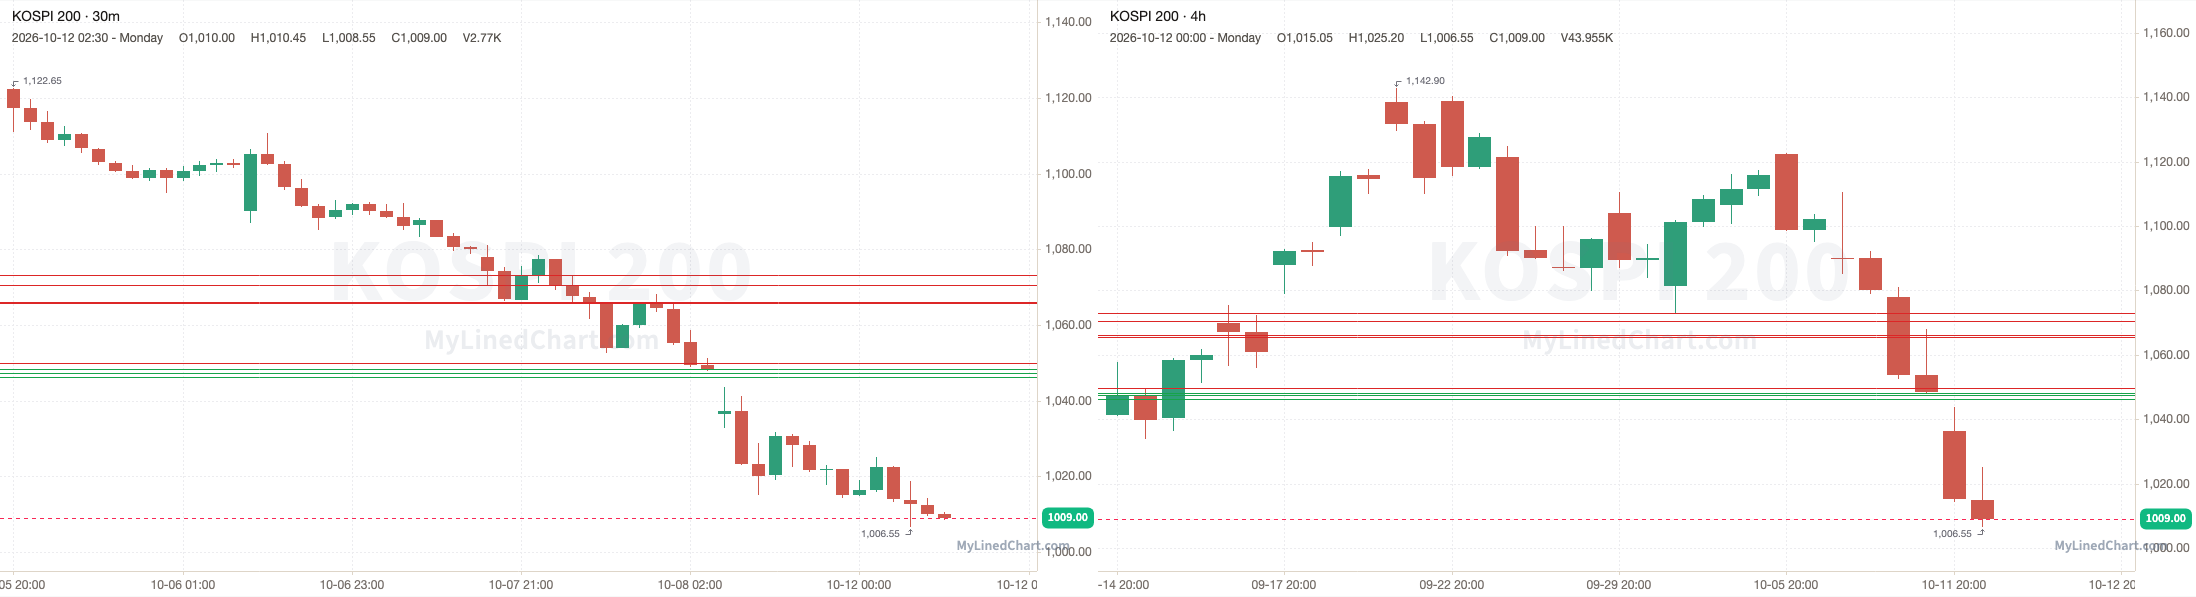
A recap of how the October 12th KOSPI 200 trading session and levels played out
KOSPI 200 opened at 1036.50, under the 1048.25 pivot and every level in the plan, and never traded back up to them, with a high of 1043.70 and a low of 1006.55, then ended up closing at 1009. Finishing the trading session down 2.65% intraday.
October 12th session levels:
All listed levels: 1046.25, 1047.40, 1048.25, 1049.85, 1065.65, 1066.10, 1070.50, 1073.05
Resistance above: 1049.85, 1065.65, 1066.10, 1070.50, 1073.05
Support below: 1048.25, 1047.40, 1046.25
Nearest pivot: 1048.25
Above 1049.85 → 1065.65 next
Lose 1048.25 → 1047.40 next
See the KOSPI 200 levels on Little Bird Trading
China: FTSE China A50
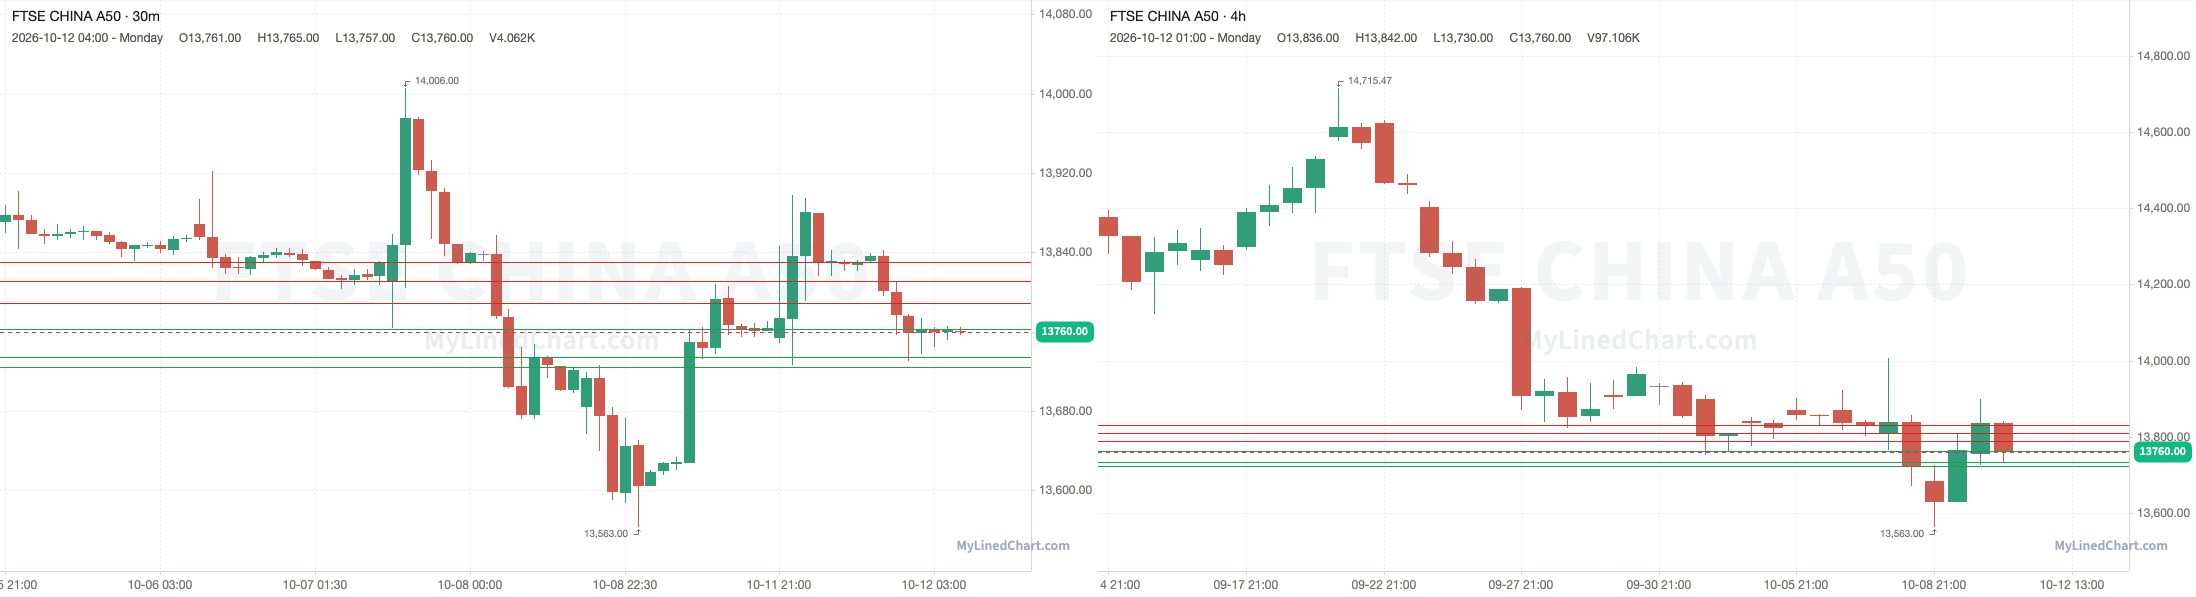
A recap of how the October 12th FTSE China A50 trading session and levels played out
FTSE China A50 opened at 13754, broke above the 13763 pivot and ran through every resistance level up to 13830, and kept going to a high of 13898, then ended up closing at 13760. Finishing the trading session up 0.04% intraday.
October 12th session levels:
All listed levels: 13724, 13735, 13763, 13789, 13811, 13830
Resistance above: 13789, 13811, 13830
Support below: 13763, 13735, 13724
Nearest pivot: 13763
Above 13789 → 13811 next
Lose 13763 → 13735 next
See the FTSE China A50 levels on Little Bird Trading
Hong Kong: Hang Seng
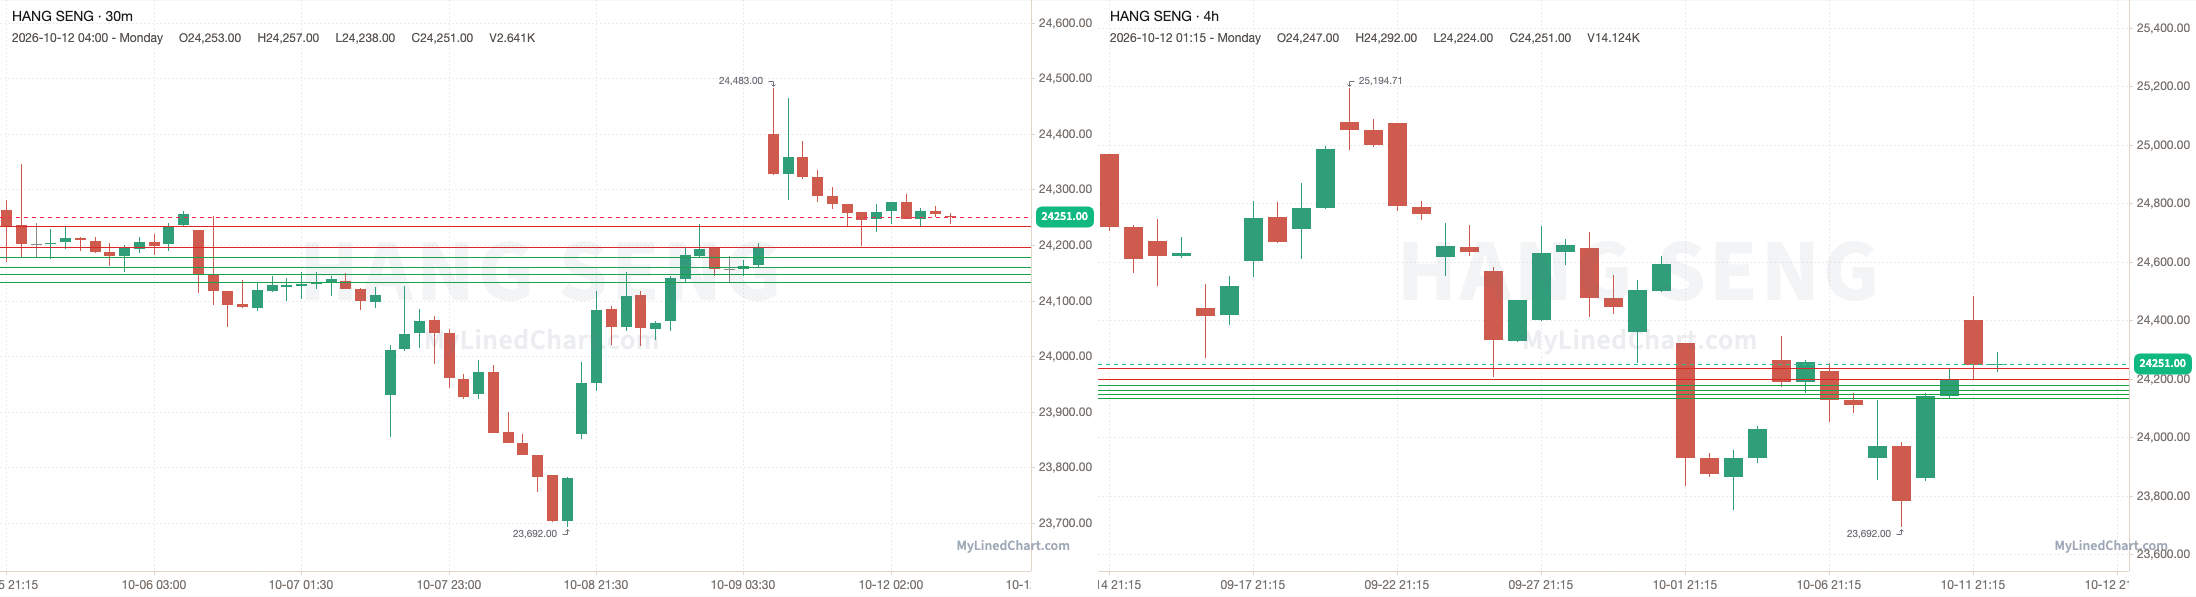
A recap of how the October 12th Hang Seng trading session and levels played out
Hang Seng opened at 24400, held above the 24197 pivot and dropped to a low of 24198, then ended up closing at 24251. Finishing the trading session down 0.61% intraday.
October 12th session levels:
All listed levels: 24133, 24148, 24160, 24179, 24197, 24235
Resistance above: 24197, 24235
Support below: 24179, 24160, 24148, 24133
Nearest pivot: 24197
Above 24197 → 24235 next
Lose 24179 → 24160 next
See the Hang Seng levels on Little Bird Trading
Taiwan: FTSE Taiwan
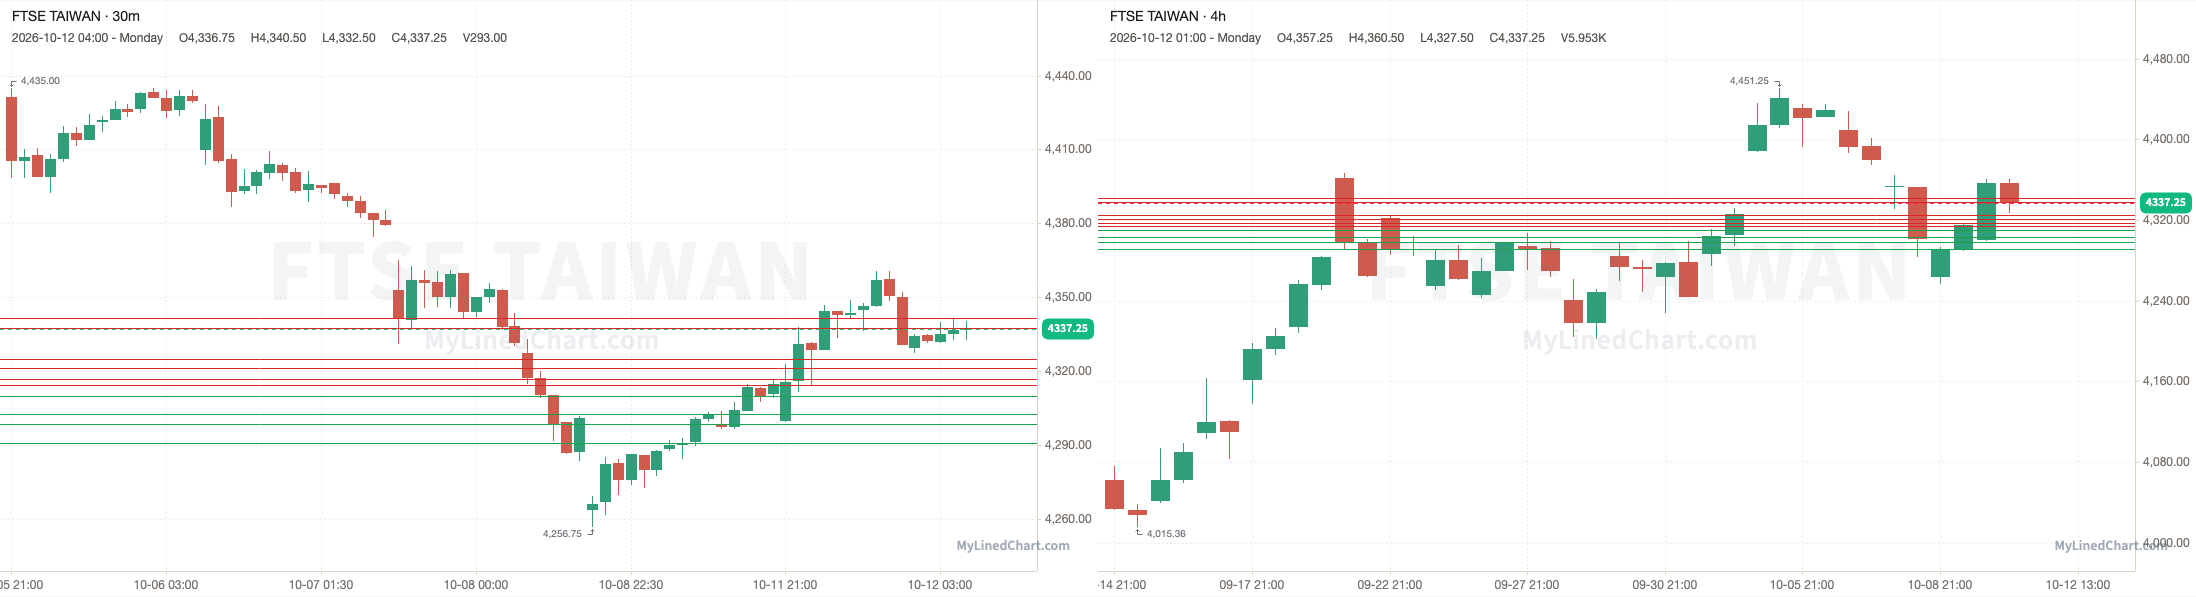
A recap of how the October 12th FTSE Taiwan trading session and levels played out
FTSE Taiwan opened at 4300, broke above the 4314.25 pivot and ran through every resistance level up to 4341.50, and kept going to a high of 4360.75, then ended up closing at 4337.25. Finishing the trading session up 0.87% intraday.
October 12th session levels:
All listed levels: 4291, 4298.50, 4302.75, 4310, 4314.25, 4317, 4321.25, 4325, 4337.50, 4341.50
Resistance above: 4314.25, 4317, 4321.25, 4325, 4337.50, 4341.50
Support below: 4310, 4302.75, 4298.50, 4291
Nearest pivot: 4314.25
Above 4314.25 → 4317 next
Lose 4310 → 4302.75 next
See the FTSE Taiwan levels on Little Bird Trading
Singapore: MSCI Singapore
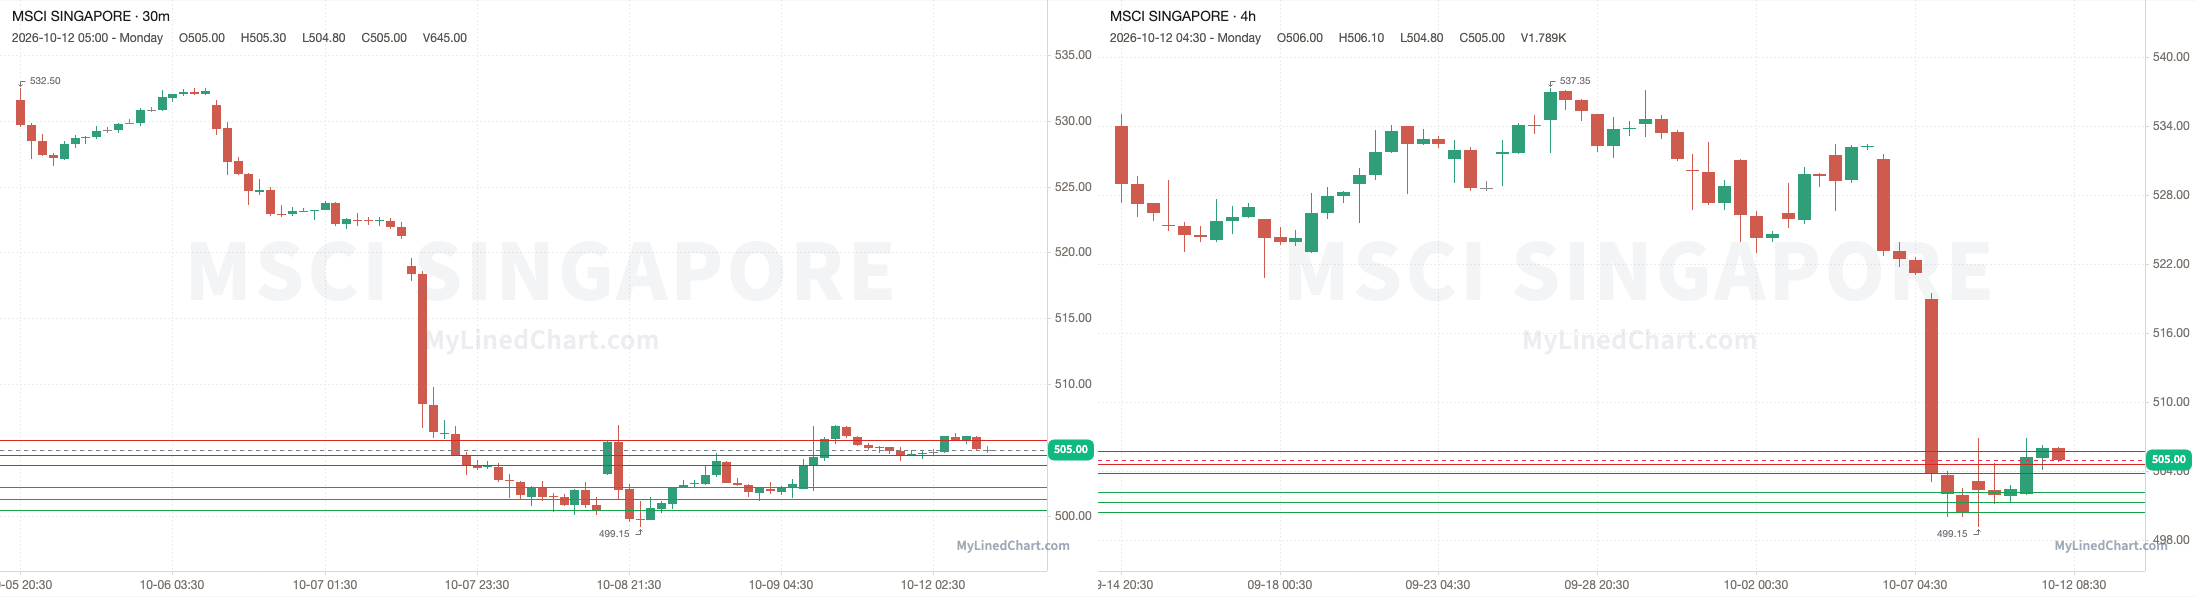
A recap of how the October 12th MSCI Singapore trading session and levels played out
MSCI Singapore opened at 502.05, broke above the 502.20 pivot and ran through every resistance level up to 505.75, and kept going to a high of 506.90, then ended up closing at 505. Finishing the trading session up 0.59% intraday.
October 12th session levels:
All listed levels: 500.45, 501.30, 502.20, 503.85, 504.65, 505.75
Resistance above: 503.85, 504.65, 505.75
Support below: 502.20, 501.30, 500.45
Nearest pivot: 502.20
Above 503.85 → 504.65 next
Lose 502.20 → 501.30 next
See the MSCI Singapore levels on Little Bird Trading
India: NIFTY 50
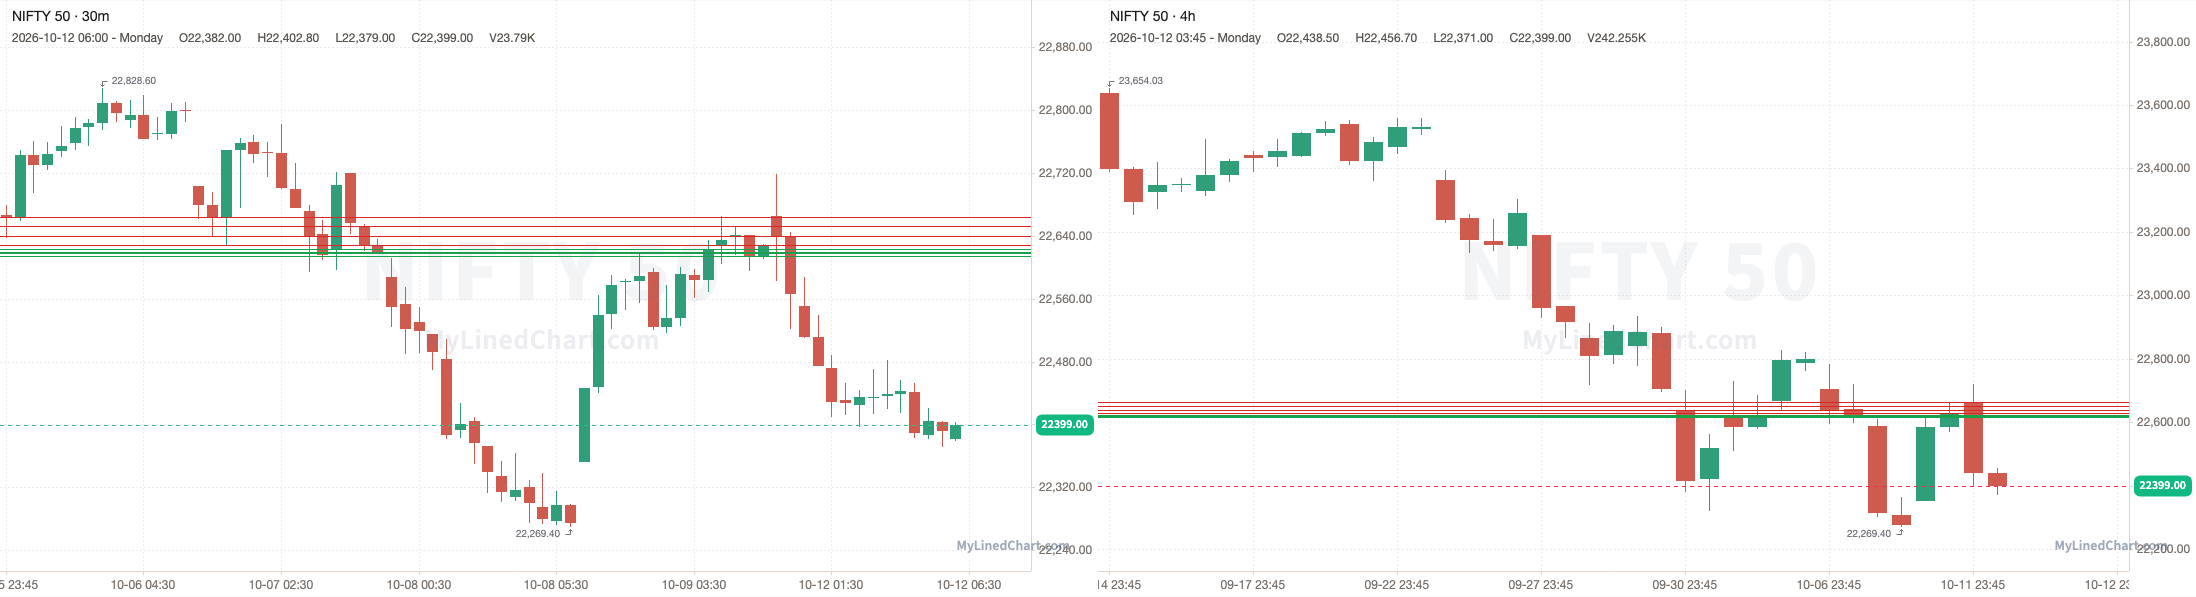
A recap of how the October 12th NIFTY 50 trading session and levels played out
NIFTY opened at 22665, broke below the 22629 pivot and ran through every support level down to 22615, and kept going to a low of 22371, then ended up closing at 22399. Finishing the trading session down 1.17% intraday and down 1.02% overall.
October 12th session levels:
All listed levels: 22615, 22618.10, 22620, 22622.90, 22623.90, 22629, 22640, 22652.50, 22664.10
Resistance above: 22629, 22640, 22652.50, 22664.10
Support below: 22623.90, 22622.90, 22620, 22618.10, 22615
Nearest pivot: 22629
Above 22629 → 22640 next
Lose 22623.90 → 22622.90 next
See the NIFTY 50 levels on Little Bird Trading
Australia: SPI
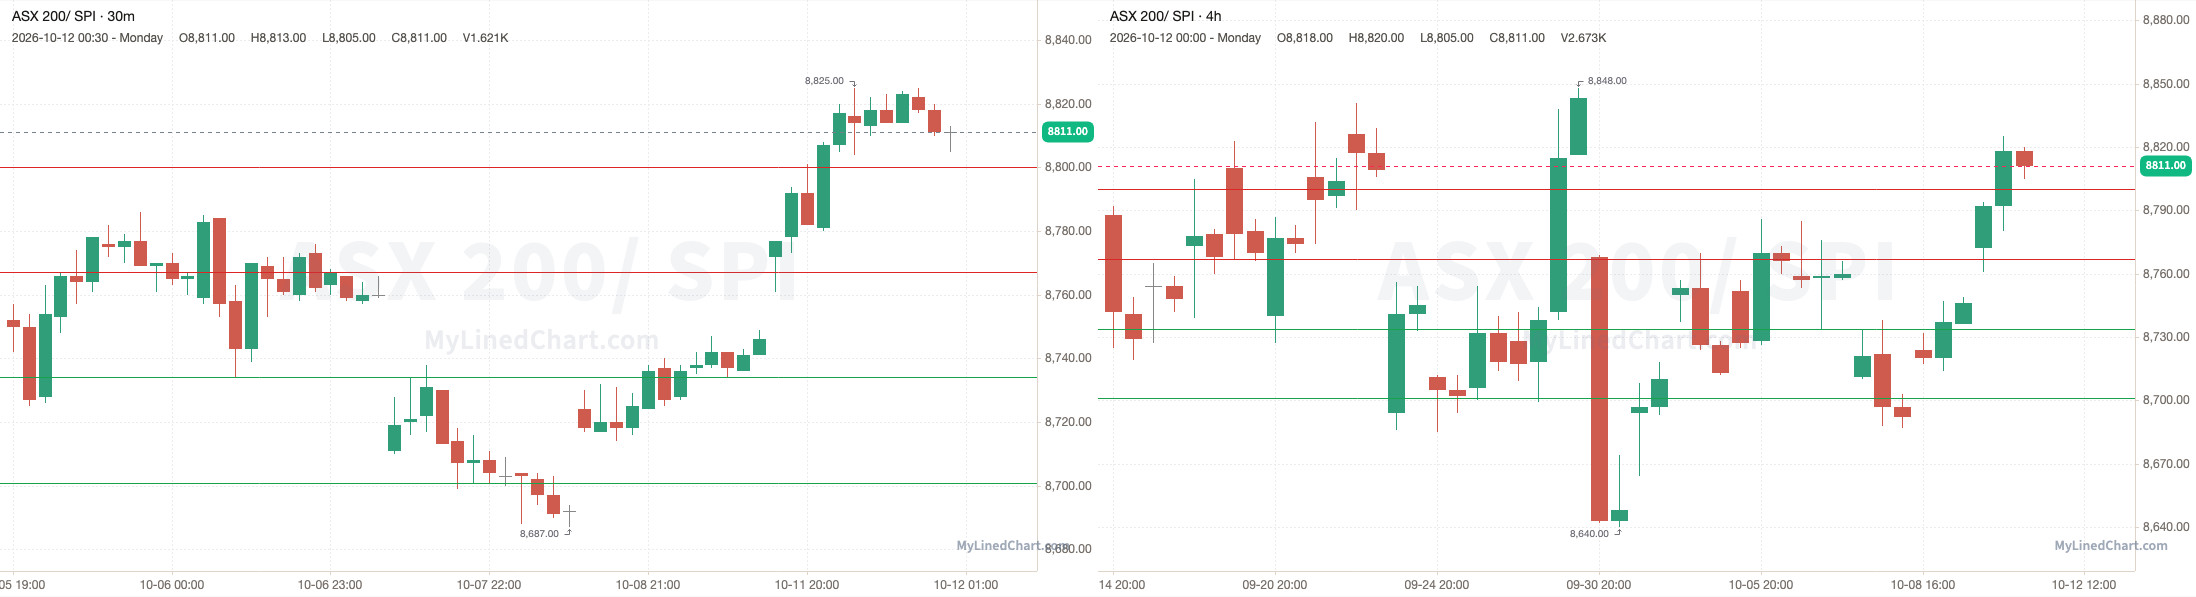
A recap of how the October 12th SPI trading session and levels played out
SPI opened at 8772, held above the 8734 pivot and ran up to tag 8800, with a high of 8825, then ended up closing at 8811. Finishing the trading session up 0.44% intraday and up 0.74% overall.
October 12th session levels:
All listed levels: 8701, 8734, 8767, 8800
Resistance above: 8767, 8800
Support below: 8734, 8701
Nearest pivot: 8734
Above 8767 → 8800 next
Lose 8734 → 8701 next
See the SPI levels on Little Bird Trading
Europe
Germany: DAX 40
A recap of how the October 12th DAX 40 trading session and levels played out
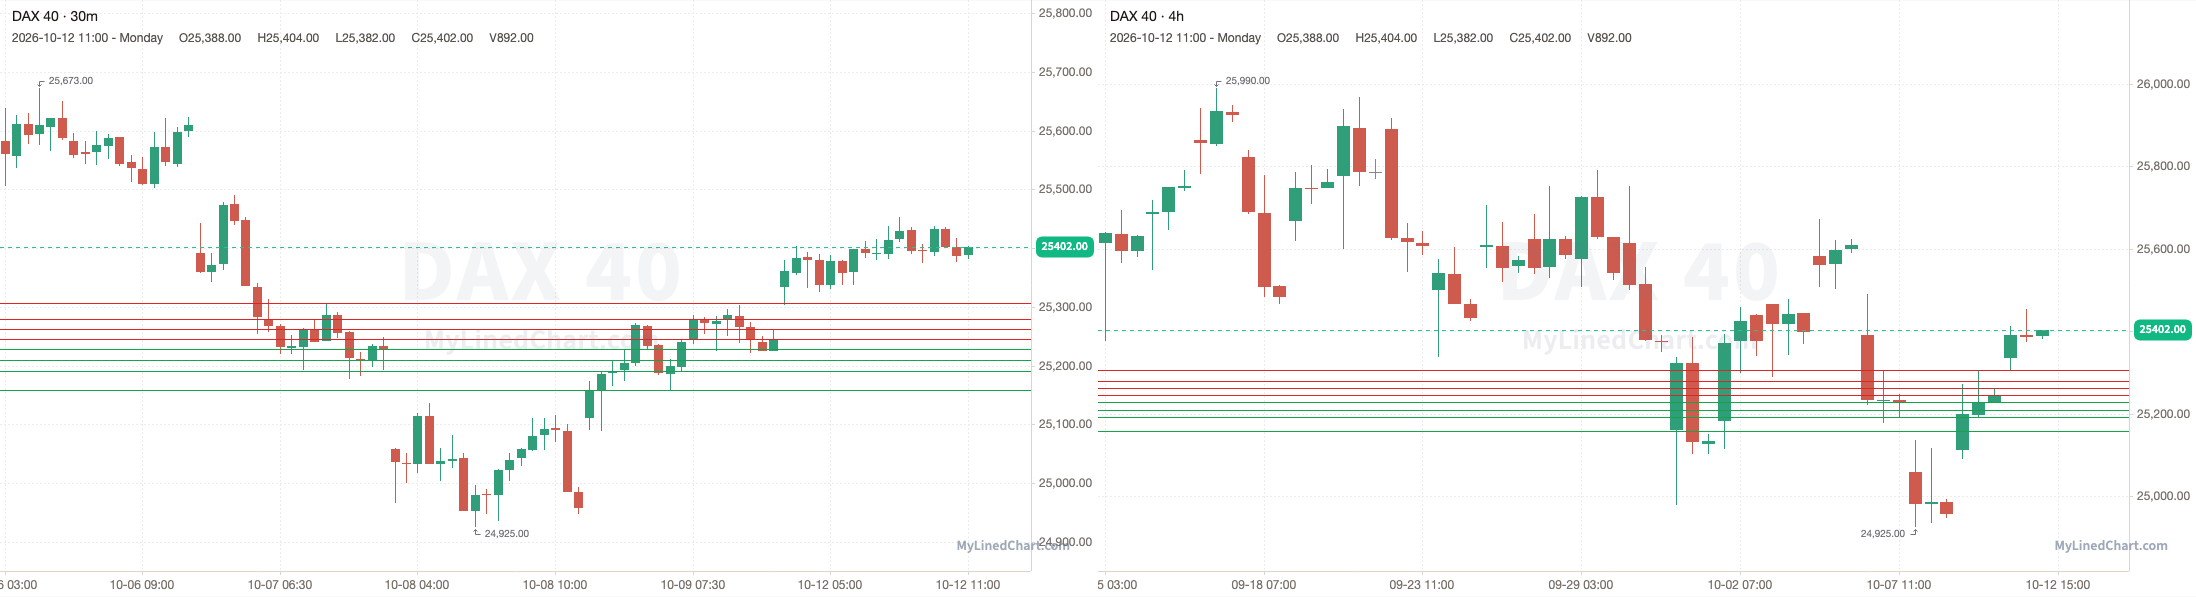
DAX 40 opened at 25334, held above the 25245 pivot and pushed to a high of 25453, then ended up closing at 25402. Finishing the trading session up 0.27% intraday.
October 12th session levels:
All listed levels: 25158, 25191, 25209, 25228, 25245, 25263, 25280, 25306
Resistance above: 25245, 25263, 25280, 25306
Support below: 25228, 25209, 25191, 25158
Nearest pivot: 25245
Above 25245 → 25263 next
Lose 25228 → 25209 next
See the DAX 40 levels on Little Bird Trading
Eurozone: Euro Stoxx 50
A recap of how the October 12th Euro Stoxx 50 trading session and levels played out
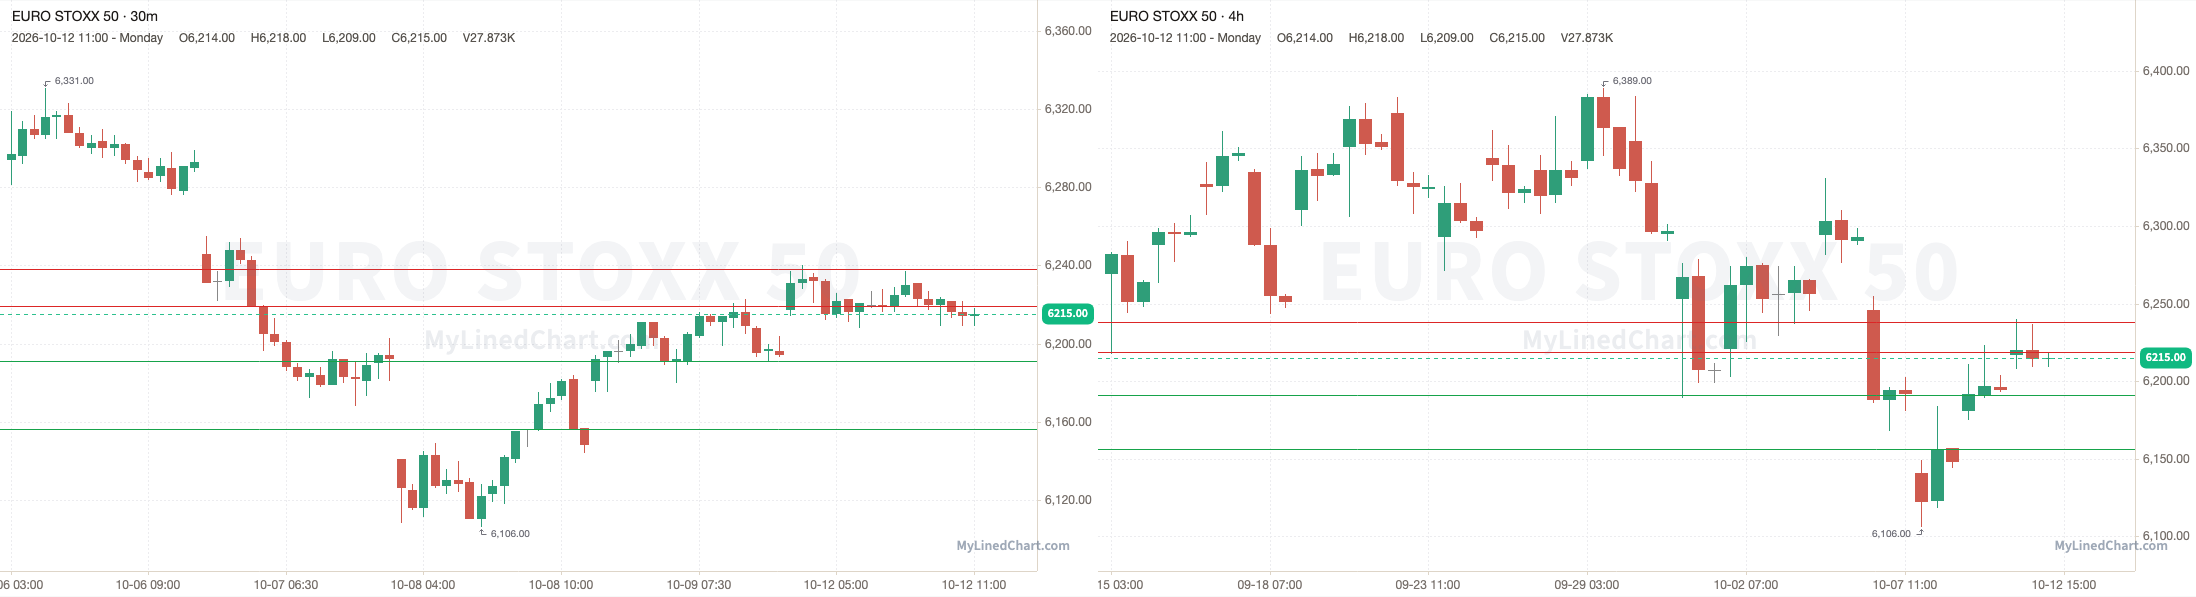
Euro Stoxx 50 opened at 6217, held above the 6191 pivot and dropped to a low of 6208, then ended up closing at 6215. Finishing the trading session down 0.03% intraday.
October 12th session levels:
All listed levels: 6156, 6191, 6219, 6238
Resistance above: 6219, 6238
Support below: 6191, 6156
Nearest pivot: 6191
Above 6219 → 6238 next
Lose 6191 → 6156 next
See the Euro Stoxx 50 levels on Little Bird Trading
UK: FTSE 100
A recap of how the October 12th FTSE 100 trading session and levels played out
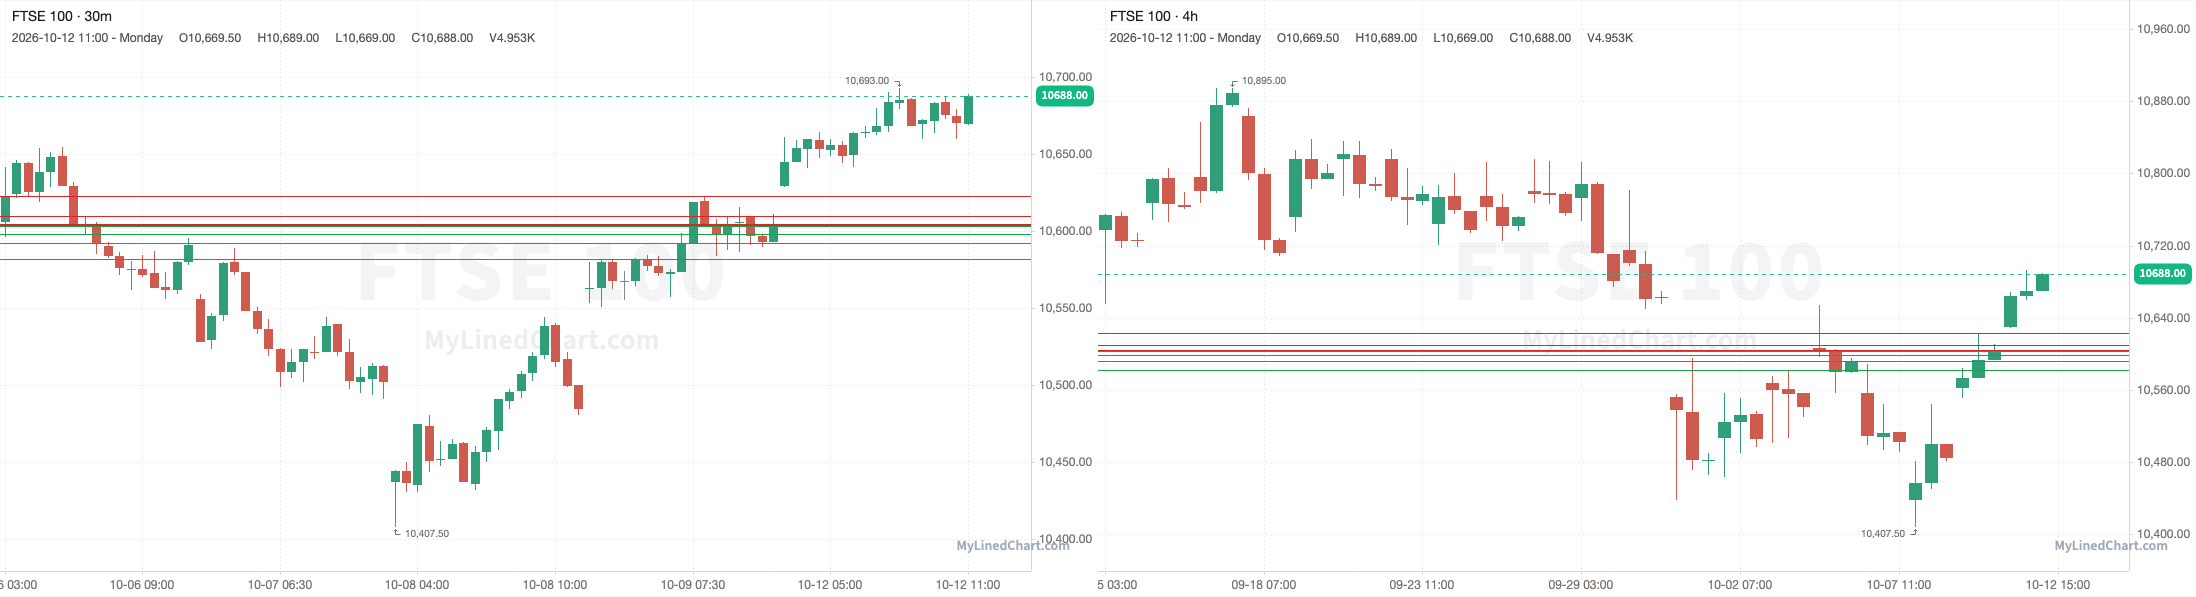
FTSE 100 opened at 10629.50, over the 10604.08 pivot and every level in the plan, and never traded back down to them, with a high of 10693 and a low of 10628.50, then ended up closing at 10688. Finishing the trading session up 0.55% intraday.
October 12th session levels:
All listed levels: 10581.50, 10592, 10598, 10603, 10603.18, 10603.58, 10604.08, 10604.50, 10604.58, 10610, 10623
Resistance above: 10604.08, 10604.50, 10604.58, 10610, 10623
Support below: 10603.58, 10603.18, 10603, 10598, 10592, 10581.50
Nearest pivot: 10604.08
Above 10604.08 → 10604.50 next
Lose 10603.58 → 10603.18 next
See the FTSE 100 levels on Little Bird Trading
France: CAC 40
A recap of how the October 12th CAC 40 trading session and levels played out
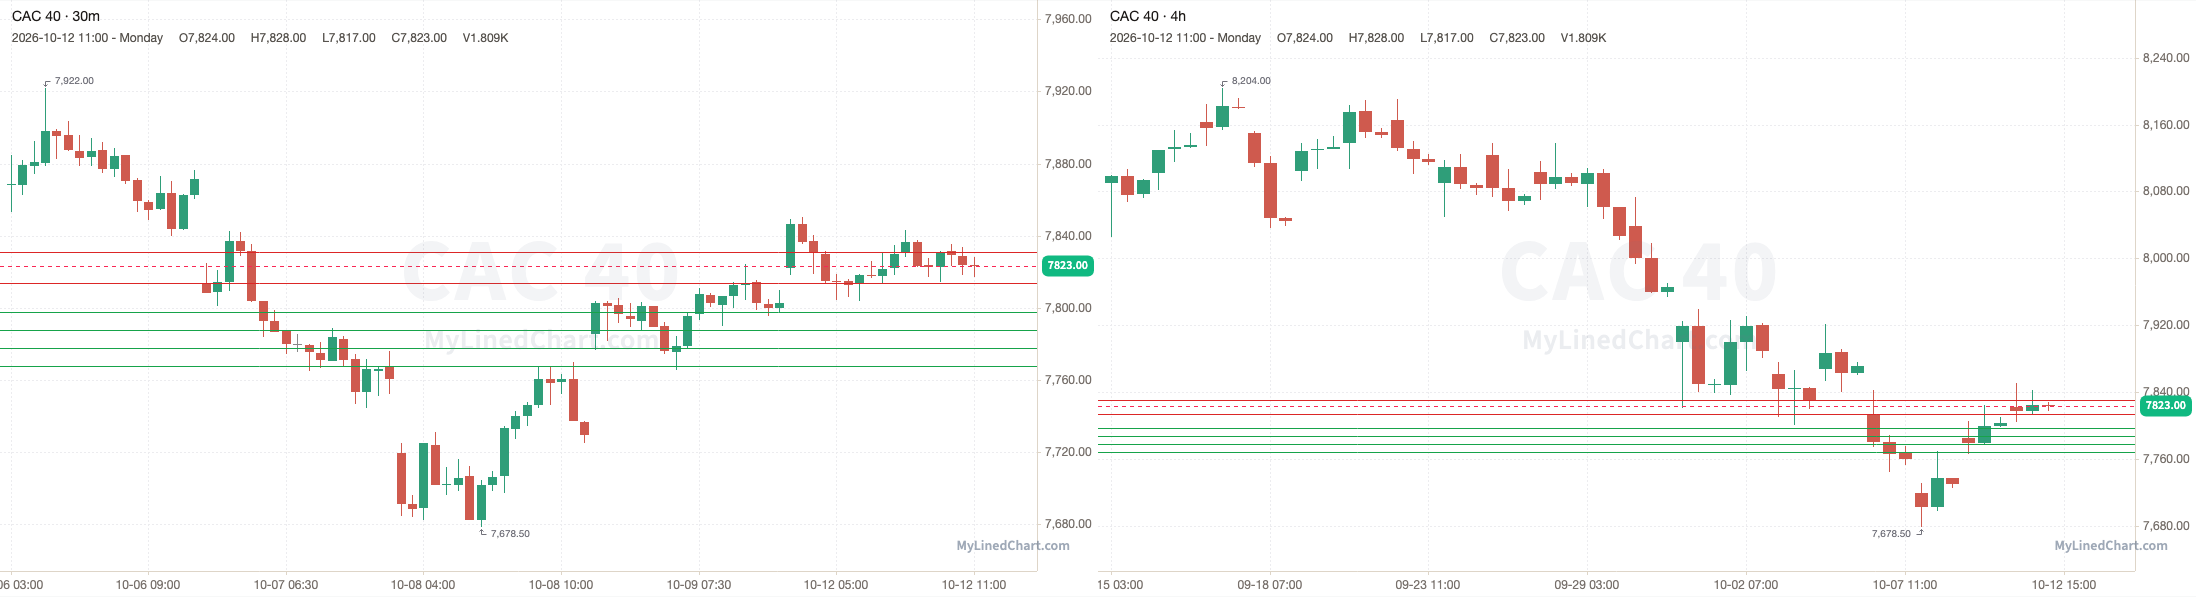
CAC 40 opened at 7822, held above the 7797.50 pivot and ran up to tag 7831, with a high of 7850.50, then ended up closing at 7823. Finishing the trading session up 0.01% intraday.
October 12th session levels:
All listed levels: 7768, 7777.50, 7787.50, 7797.50, 7814, 7831
Resistance above: 7814, 7831
Support below: 7797.50, 7787.50, 7777.50, 7768
Nearest pivot: 7797.50
Above 7814 → 7831 next
Lose 7797.50 → 7787.50 next
See the CAC 40 levels on Little Bird Trading
Spain: IBEX 35
A recap of how the October 12th IBEX 35 trading session and levels played out
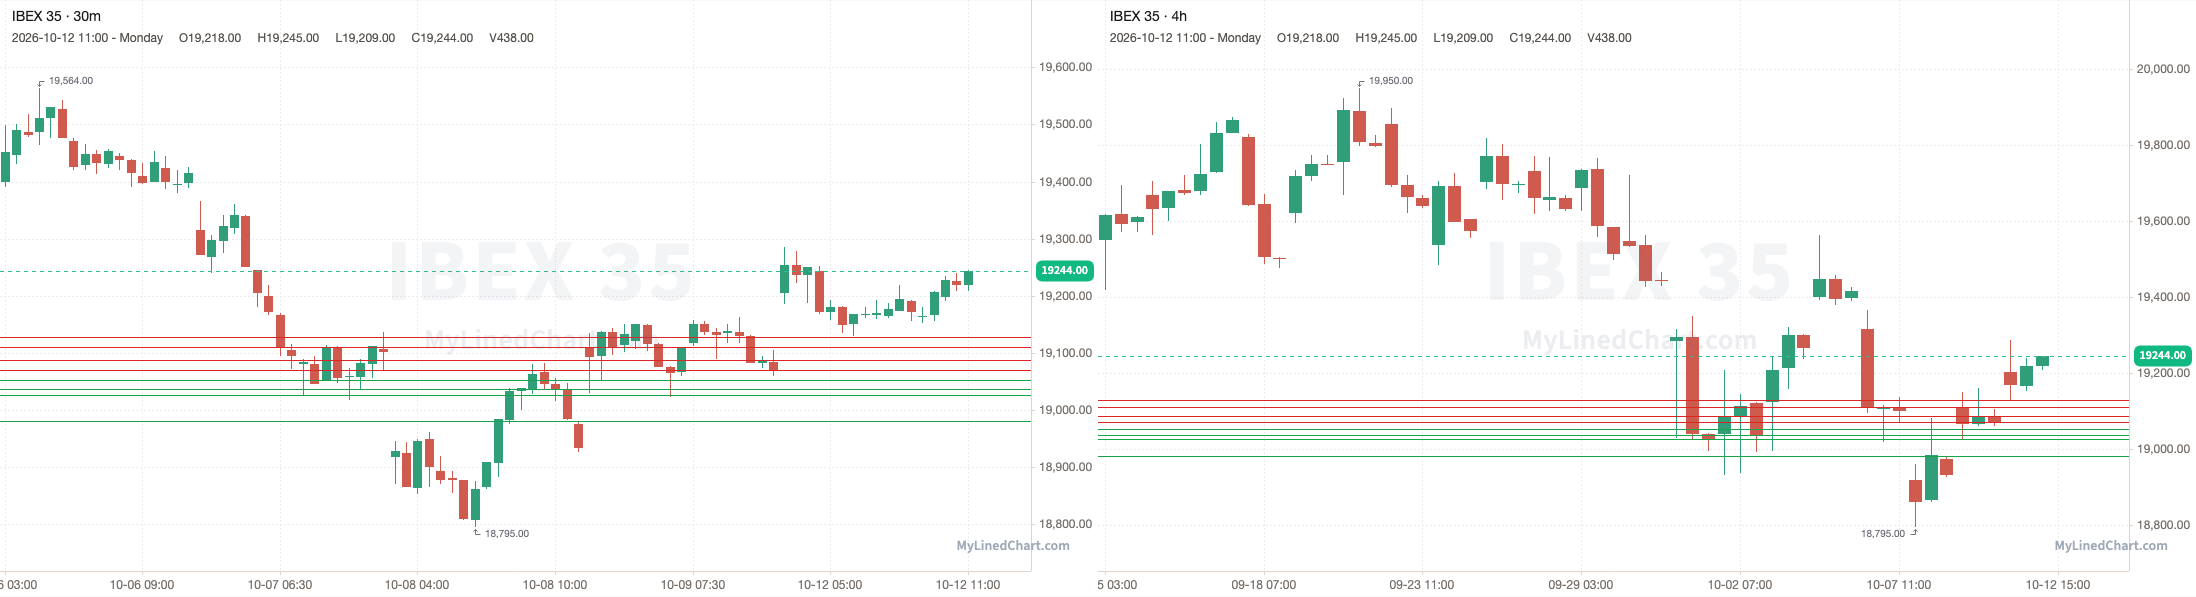
IBEX 35 opened at 19204, over the 19070 pivot and every level in the plan, and never traded back down to them, with a high of 19286 and a low of 19130, then ended up closing at 19244. Finishing the trading session up 0.21% intraday.
October 12th session levels:
All listed levels: 18981, 19026, 19037, 19053, 19070, 19087, 19110, 19128
Resistance above: 19070, 19087, 19110, 19128
Support below: 19053, 19037, 19026, 18981
Nearest pivot: 19070
Above 19070 → 19087 next
Lose 19053 → 19037 next
See the IBEX 35 levels on Little Bird Trading
Italy: FTSE MIB
A recap of how the October 12th FTSE MIB trading session and levels played out
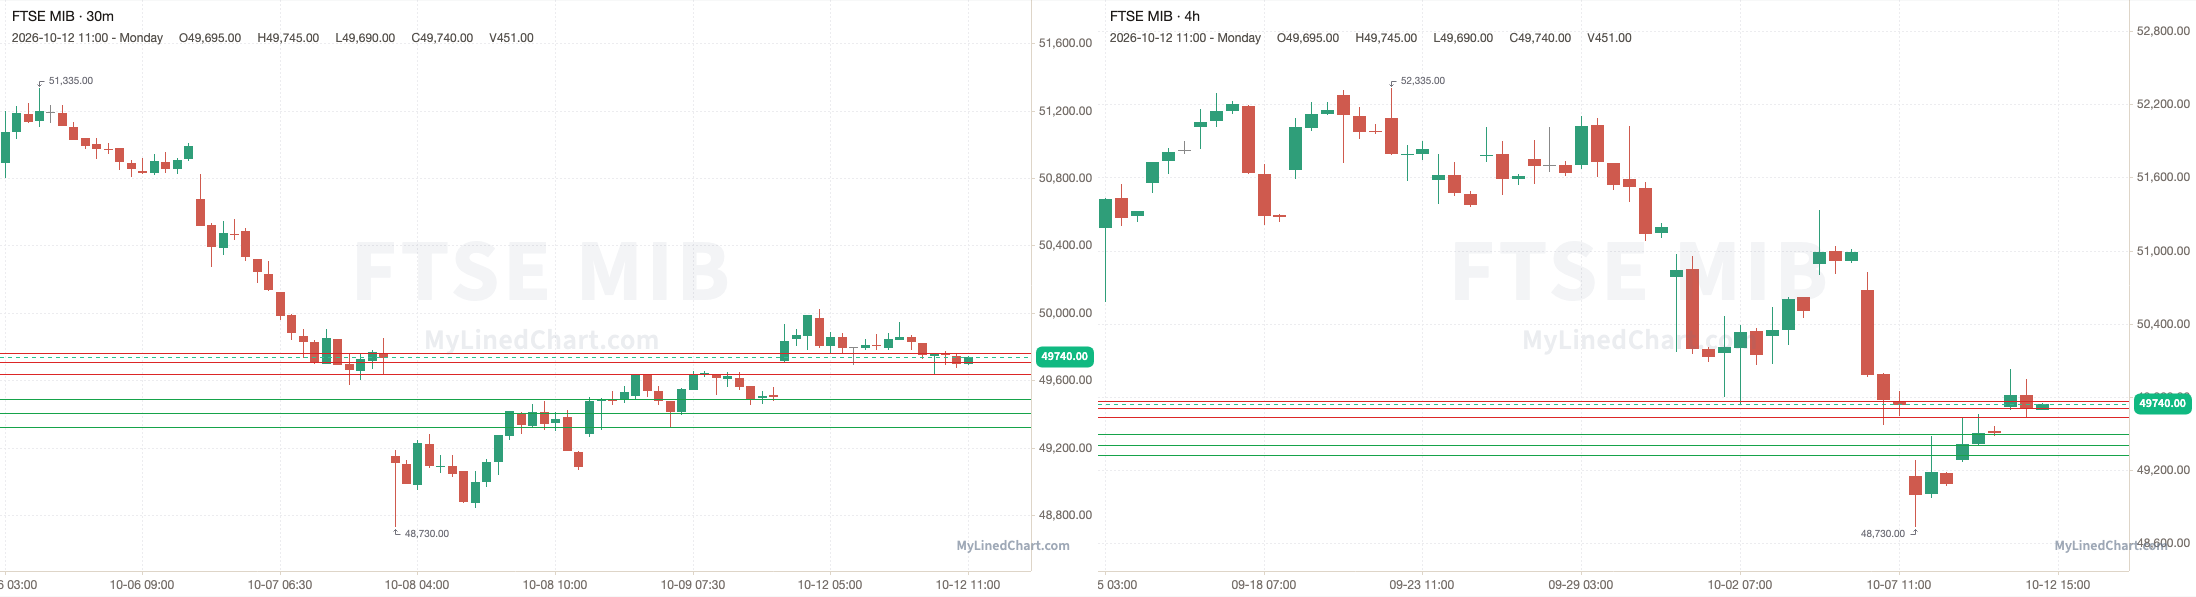
FTSE MIB opened at 49715, held above the 49490 pivot and ran up to tag 49765, with a high of 50025, then ended up closing at 49740. Finishing the trading session up 0.05% intraday.
October 12th session levels:
All listed levels: 49325, 49405, 49490, 49635, 49710, 49765
Resistance above: 49635, 49710, 49765
Support below: 49490, 49405, 49325
Nearest pivot: 49490
Above 49635 → 49710 next
Lose 49490 → 49405 next
See the FTSE MIB levels on Little Bird Trading
Netherlands: AEX
A recap of how the October 12th AEX trading session and levels played out
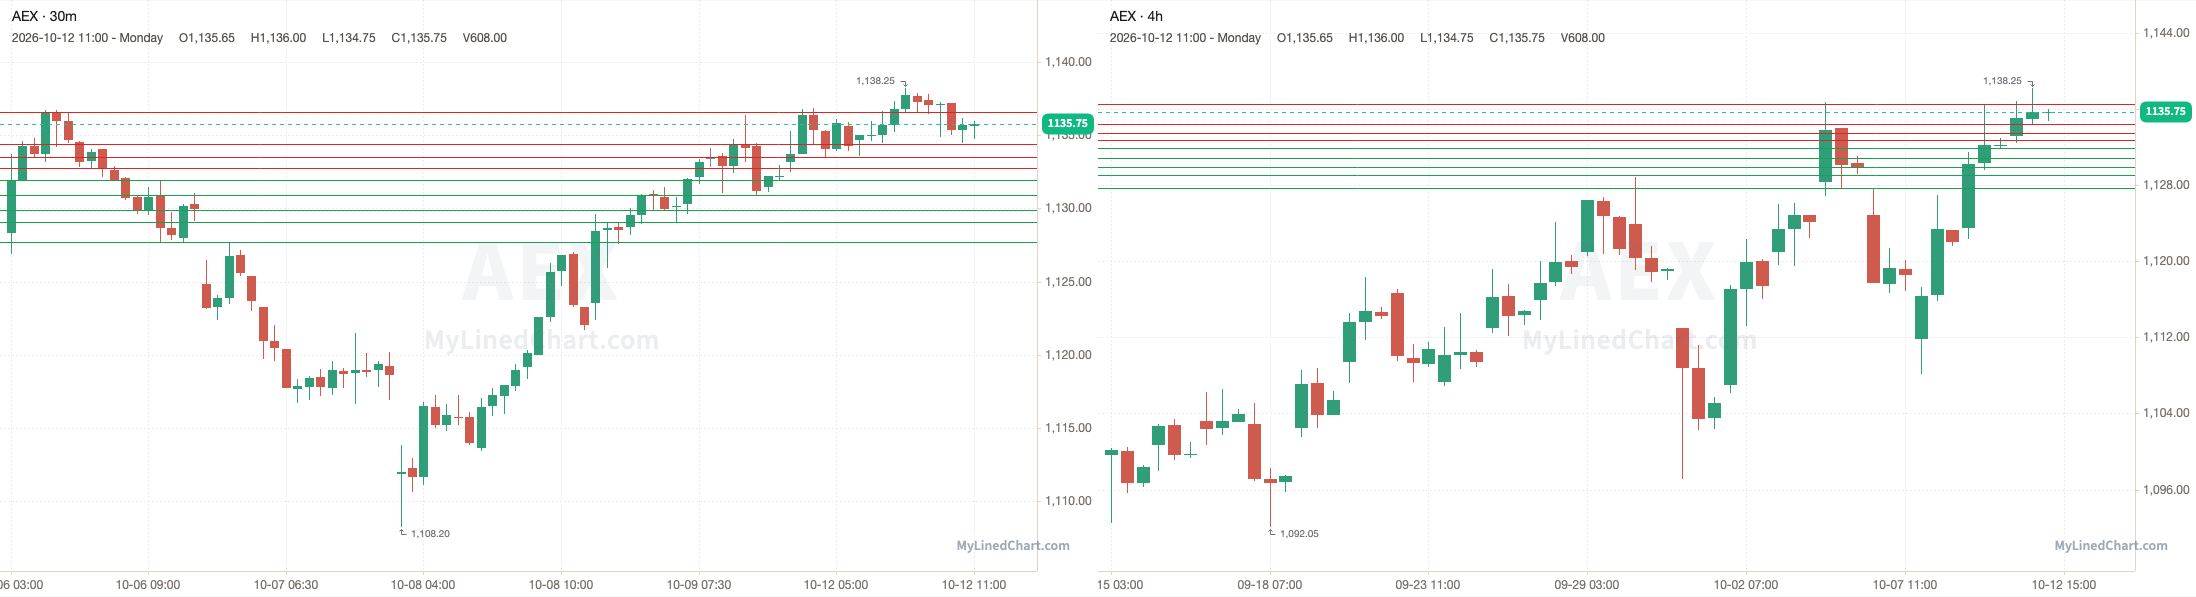
AEX opened at 1133.15, held above the 1131.95 pivot and ran up to tag 1136.60, with a high of 1138.25, then ended up closing at 1135.75. Finishing the trading session up 0.23% intraday.
October 12th session levels:
All listed levels: 1127.70, 1129.05, 1129.90, 1130.90, 1131.95, 1132.80, 1133.50, 1134.40, 1136.60
Resistance above: 1132.80, 1133.50, 1134.40, 1136.60
Support below: 1131.95, 1130.90, 1129.90, 1129.05, 1127.70
Nearest pivot: 1131.95
Above 1132.80 → 1133.50 next
Lose 1131.95 → 1130.90 next
See the AEX levels on Little Bird Trading
Sweden: OMXS30
A recap of how the October 12th OMXS30 trading session and levels played out
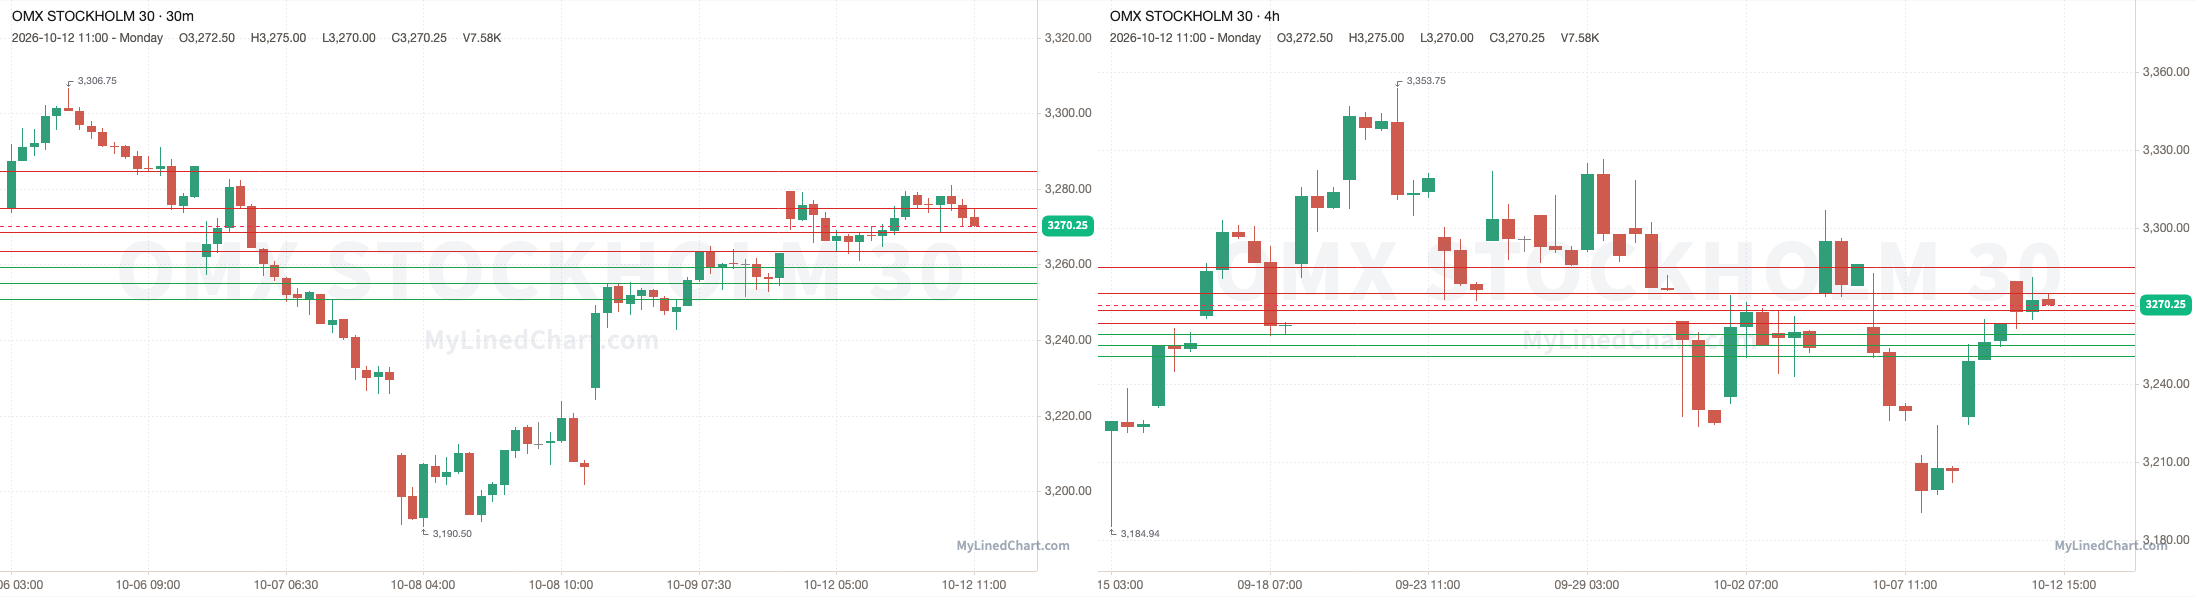
OMXS30 opened at 3279.50, broke below the 3263.50 pivot and dropped to a low of 3261, then ended up closing at 3270.25. Finishing the trading session down 0.28% intraday.
October 12th session levels:
All listed levels: 3250.75, 3255, 3259.25, 3263.50, 3268.50, 3275, 3284.75
Resistance above: 3263.50, 3268.50, 3275, 3284.75
Support below: 3259.25, 3255, 3250.75
Nearest pivot: 3263.50
Above 3263.50 → 3268.50 next
Lose 3259.25 → 3255 next
See the OMXS30 levels on Little Bird Trading
Switzerland: SMI
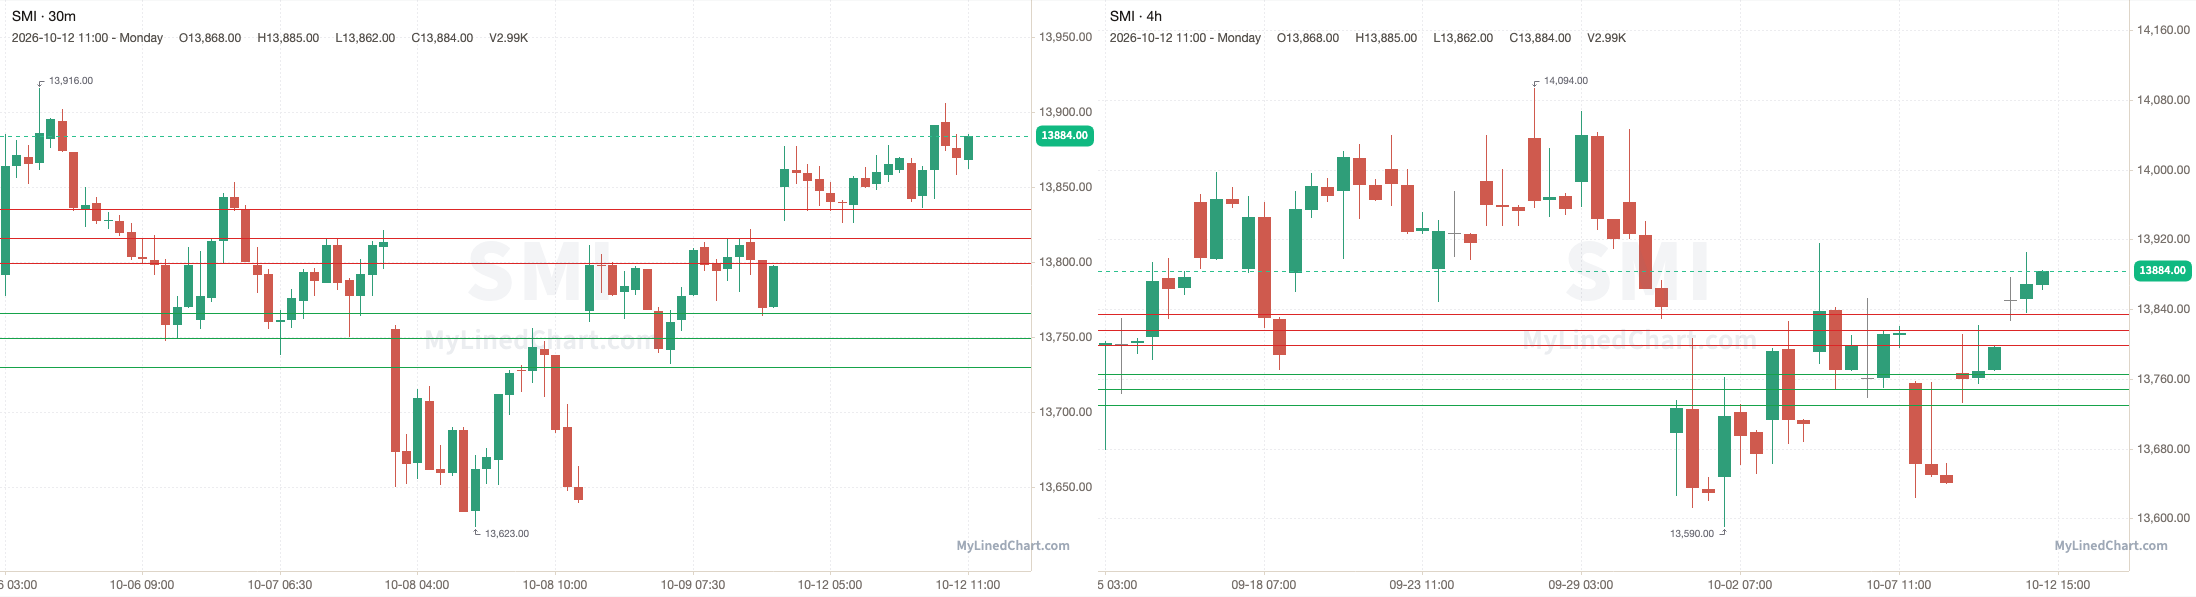
A recap of how the October 12th SMI trading session and levels played out
SMI opened at 13850, held above the 13799 pivot and pushed to a high of 13906, then ended up closing at 13884. Finishing the trading session up 0.25% intraday.
October 12th session levels:
All listed levels: 13730, 13749, 13766, 13799, 13816, 13835
Resistance above: 13799, 13816, 13835
Support below: 13766, 13749, 13730
Nearest pivot: 13799
Above 13799 → 13816 next
Lose 13766 → 13749 next
See the SMI levels on Little Bird Trading
Latin America
Mexico: S&P/BMV IPC
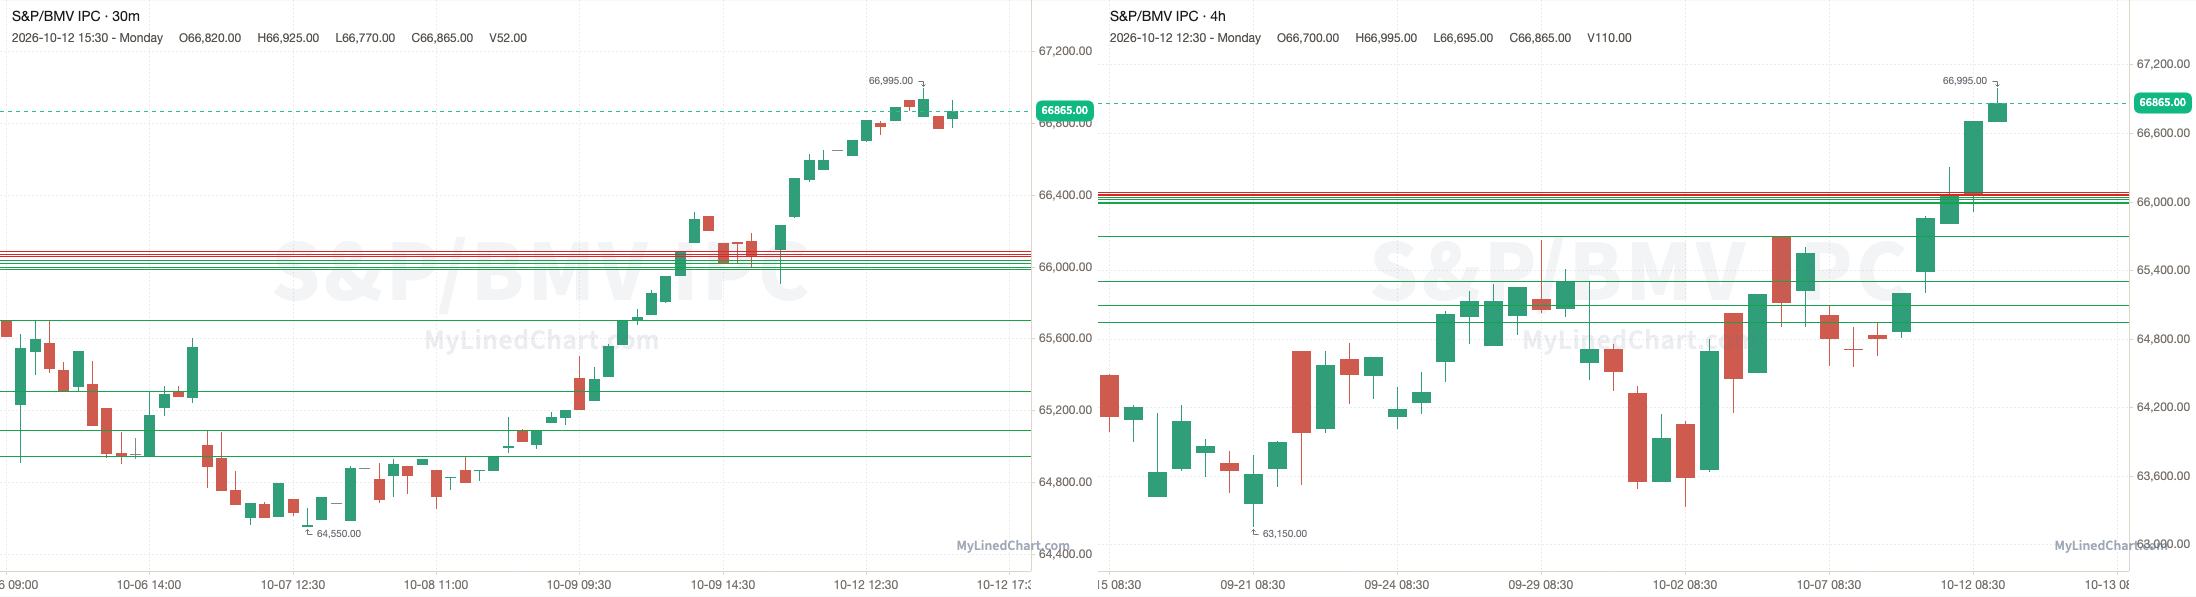
A recap of how the October 12th S&P/BMV IPC trading session and levels played out
S&P/BMV IPC opened at 66060, dipped below the 66060 pivot to a low of 65905, then reclaimed it and ran through every resistance level up to 66086, and kept going to a high of 66995, then ended up closing at 66865. Finishing the trading session up 1.22% intraday.
October 12th session levels:
All listed levels: 64945, 65090, 65305, 65700, 65988, 65999, 66021, 66039, 66060, 66069, 66086
Resistance above: 66069, 66086
Support below: 66039, 66021, 65999, 65988, 65700, 65305, 65090, 64945
Nearest pivot: 66060
Above 66069 → 66086 next
Lose 66039 → 66021 next
See the S&P/BMV IPC levels on Little Bird Trading
Brazil: Ibovespa
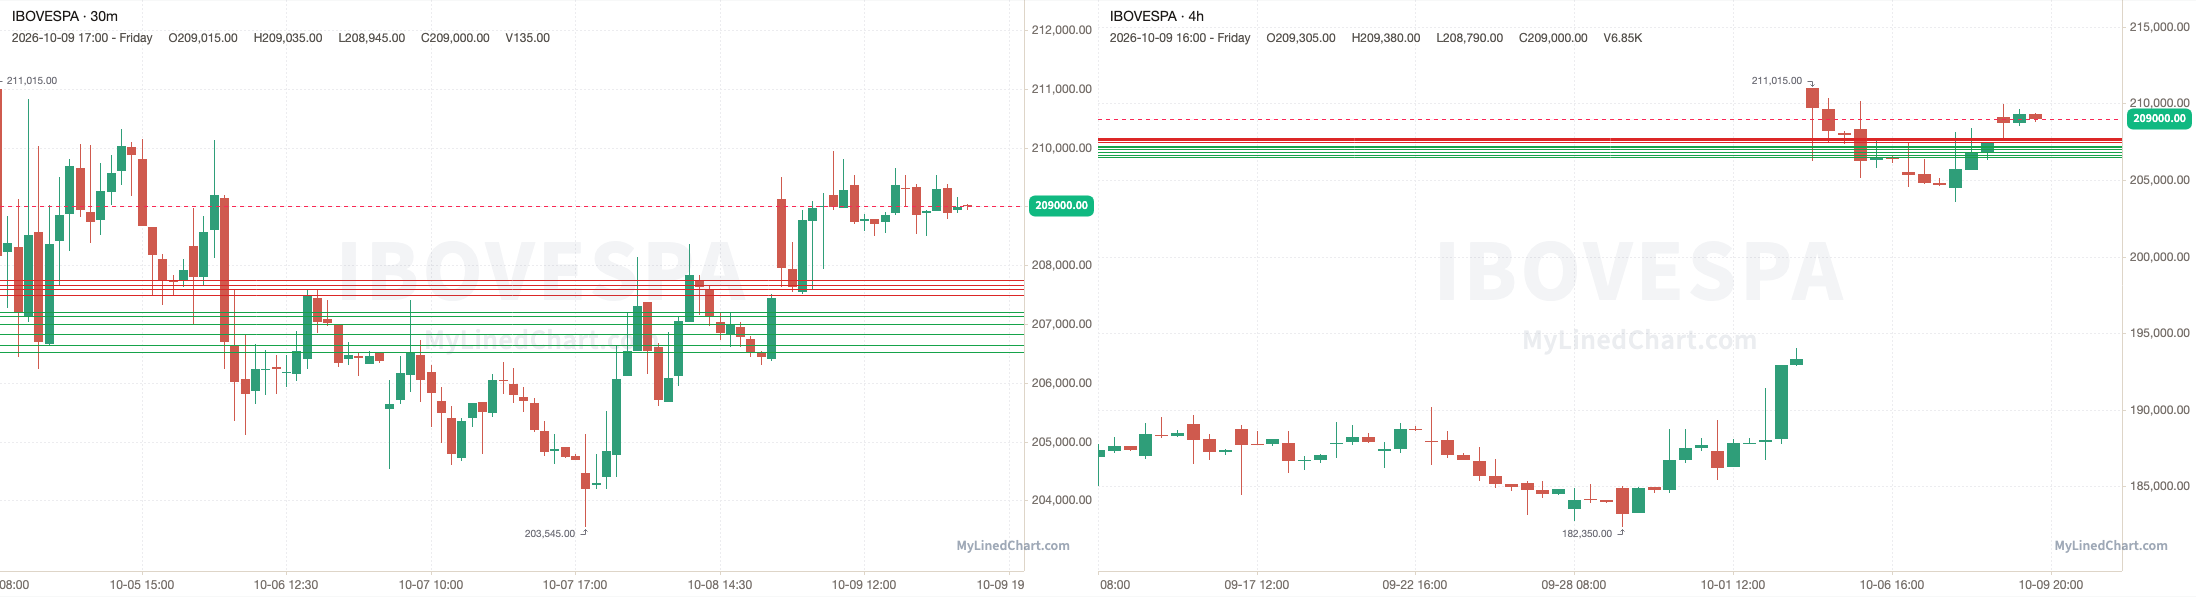
A recap of how the October 9th Ibovespa trading session and levels played out
Ibovespa opened at 209120, held above the 207495 pivot and dropped to a low of 207515, then ended up closing at 209000. Finishing the trading session down 0.06% intraday.
October 9th session levels:
All listed levels: 206530, 206635, 206830, 207005, 207140, 207195, 207495, 207600, 207655, 207745
Resistance above: 207495, 207600, 207655, 207745
Support below: 207195, 207140, 207005, 206830, 206635, 206530
Nearest pivot: 207495
Above 207495 → 207600 next
Lose 207195 → 207140 next
See the Ibovespa levels on Little Bird Trading
Disclaimer: Little Bird Trading and any of its associations may or may not, whether long or short, have a position in any instruments. Not investment advice. Provided for informational purposes only. Not a recommendation or endorsement. Not registered or licensed. Model portfolios are property of their respective owners. All data is sourced from publicly available information. No guarantee is being made or offered. Not responsible for financial loss or ruin. Little Bird Trading may earn a commission if you purchase through links on the site.
Day Trade Levels for the October 13th Trading Session:
Enjoying this content?
Subscribe on Substack