

SPY Support and Resistance for Oct 14: Sidelined
Support, resistance and pivot levels for SPY, ES, QQQ, NQ and 19 stock markets across Asia, Europe and the Americas ahead of the October 14th session, plus how the last session's levels traded.
Little Bird Trading is in 15+ languages. View this report in:
Deutsch · 日本語 · Español (España) · Español · 한국어 · 简体中文 · हिन्दी · Français · Português (Brasil) · Português (Portugal) · 繁體中文 · Italiano · Nederlands · Svenska

MyLinedChart
✅ Draw your levels once
✅ Export them as XLSX JSON or CSV
✅ Let your AI turn them into trading rules
Looking for a pro to build your trading workflows? Reach out on Upwork.
Get each market's levels about 1 hour after the close with Pro on Little Bird Trading.
US
A recap of how the October 13th trading session and levels played out
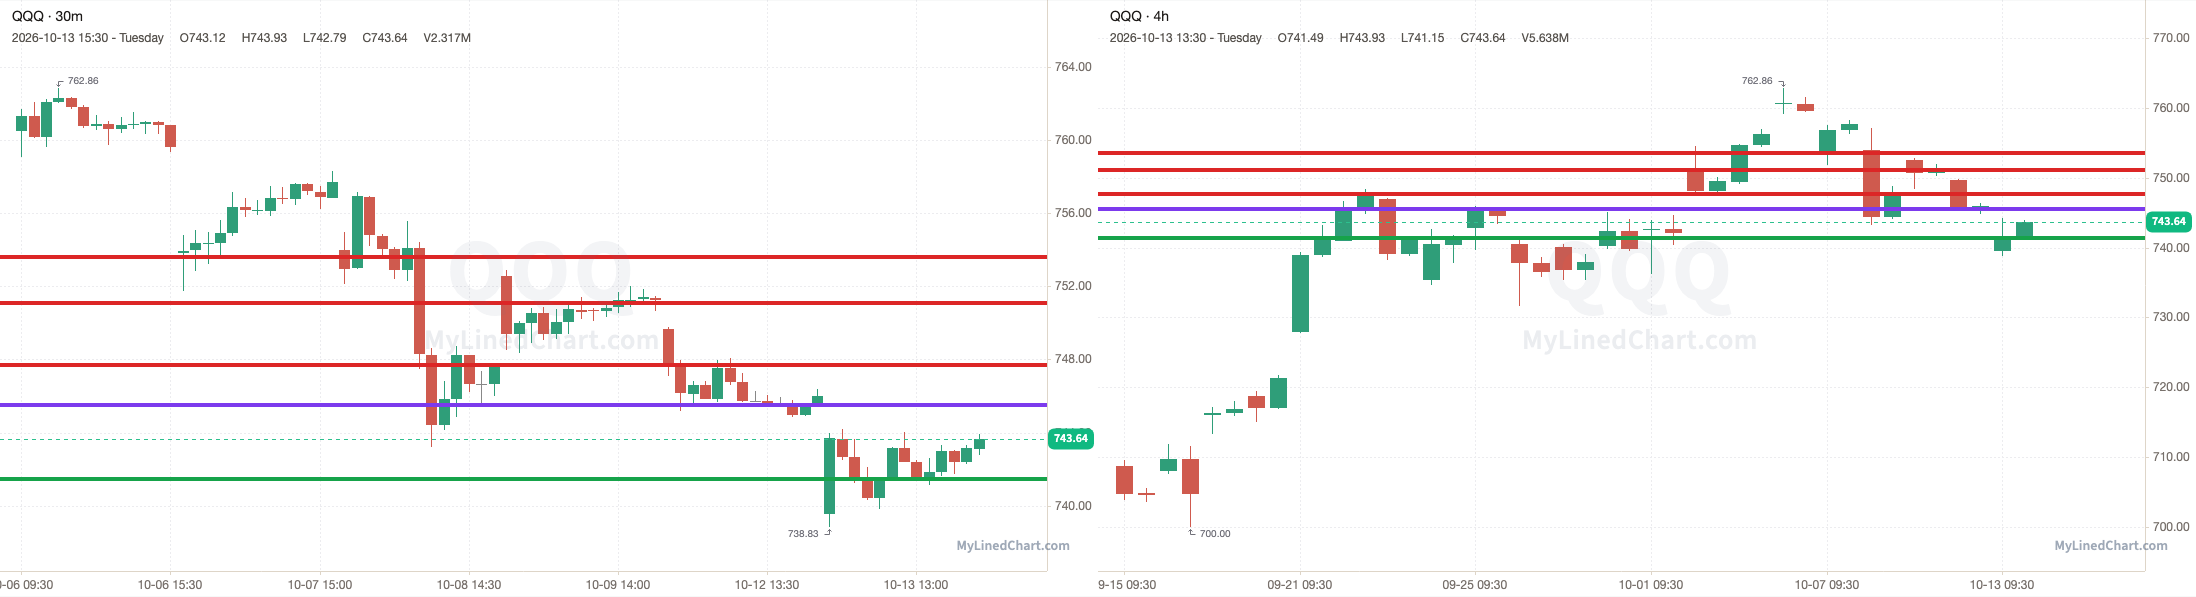
QQQ opened at 739.53, stayed under the 745.50 pivot and pushed to a high of 744.20, then ended up closing at 743.64. QQQ finished up 0.56% intraday and down 0.31% overall.
October 13th session levels:
All listed levels: 741.44, 745.50, 747.67, 751.09, 753.60
Resistance above: 747.67, 751.09, 753.60
Support below: 745.50, 741.44
Nearest pivot: 745.50
Above 747.67 → 751.09 next
Lose 745.50 → 741.44 next
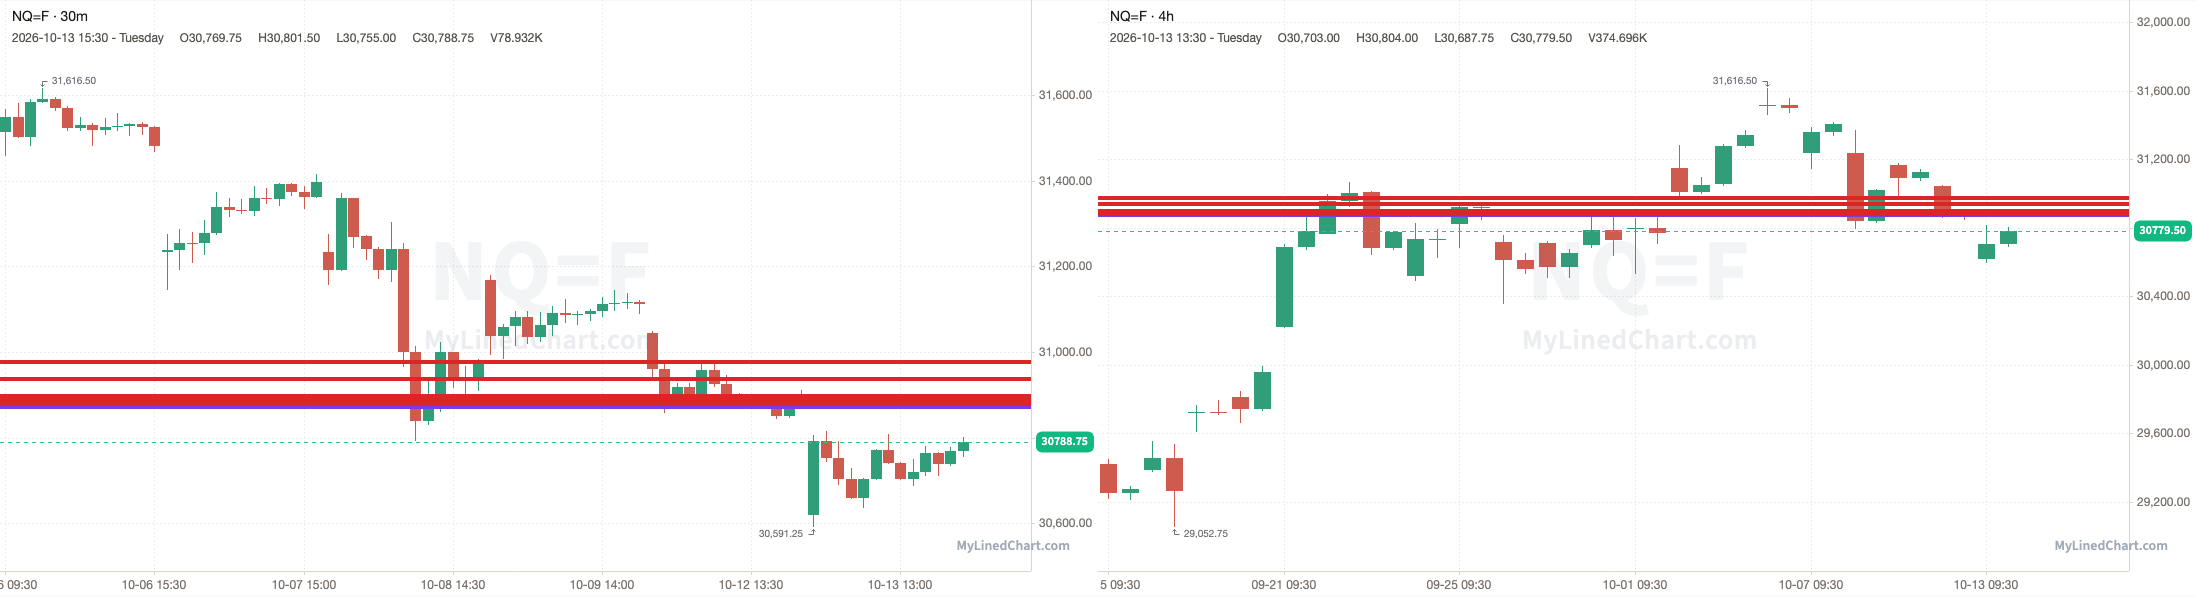
NQ opened at 30619.75, under the 30878.25 pivot and every level in the plan, and never traded back up to them, with a high of 30815 and a low of 30591.25, then ended up closing at 30779.50. NQ finished up 0.52% intraday and down 0.32% overall.
October 13th session levels:
All listed levels: 30871.50, 30878.25, 30882.50, 30885.50, 30891.50, 30896.50, 30936.25, 30975.50
Resistance above: 30878.25, 30882.50, 30885.50, 30891.50, 30896.50, 30936.25, 30975.50
Support below: 30871.50
Nearest pivot: 30878.25
Above 30878.25 → 30882.50 next
Lose 30871.50 → open air
See the SPY, ES, QQQ & NQ levels on Little Bird Trading
Asia
Japan: Nikkei 225
A recap of how the October 13th Nikkei 225 trading session and levels played out
No Nikkei 225 levels were set up on October 13th. A patience day: protect capital and wait for the levels to come back.
See the Nikkei 225 levels on Little Bird Trading
Korea: KOSPI 200
A recap of how the October 13th KOSPI 200 trading session and levels played out
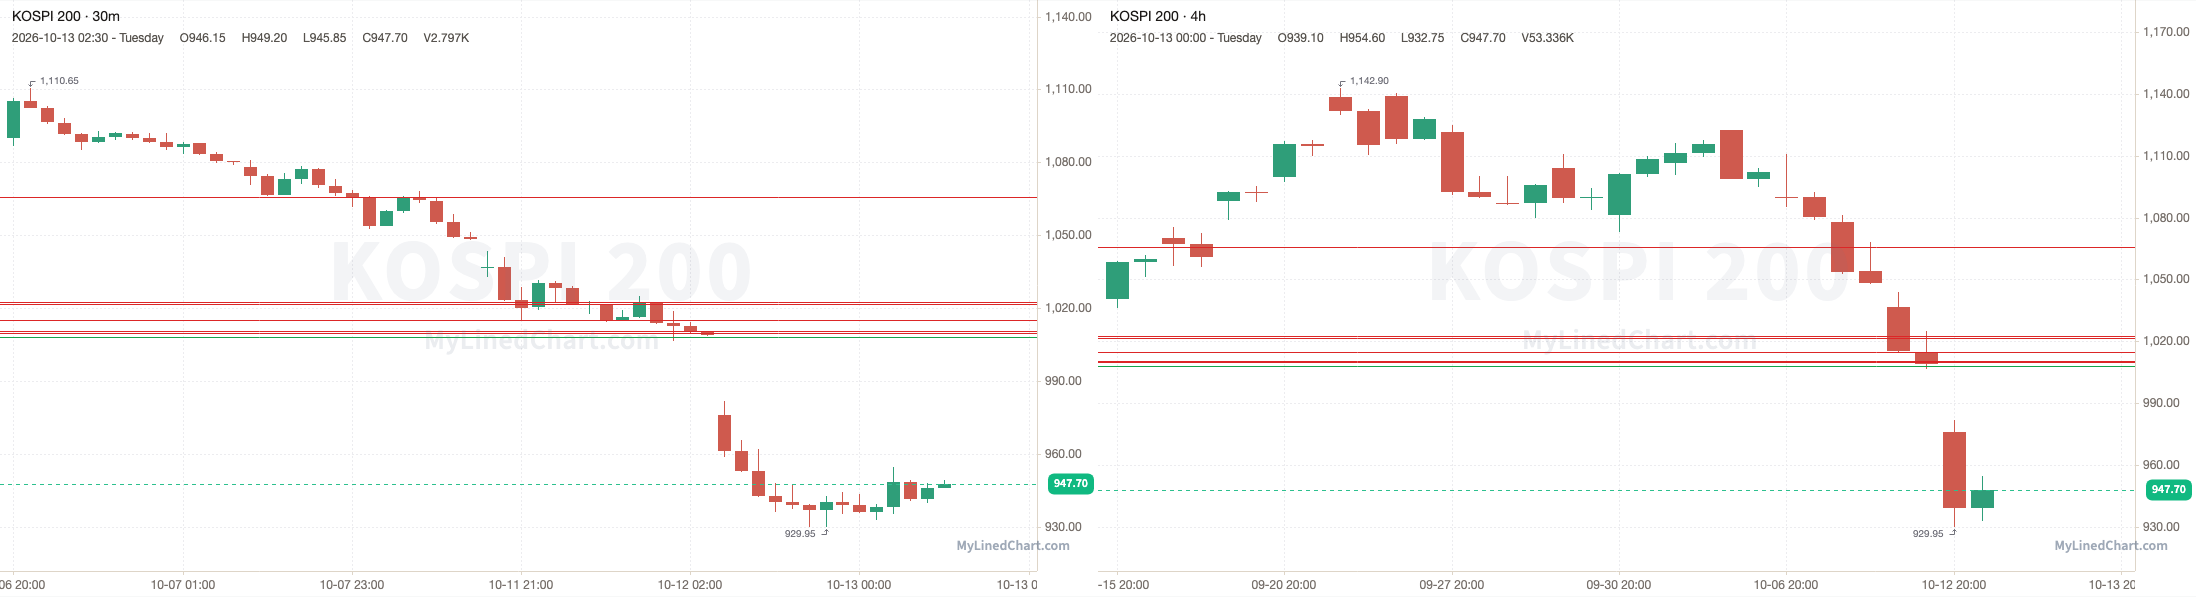
KOSPI 200 opened at 976.20, under the 1009.75 pivot and every level in the plan, and never traded back up to them, with a high of 981.70 and a low of 929.95, then ended up closing at 947.70. Finishing the trading session down 2.92% intraday.
October 13th session levels:
All listed levels: 1008.20, 1009.75, 1010.65, 1015.05, 1021.75, 1022.55, 1065.65
Resistance above: 1009.75, 1010.65, 1015.05, 1021.75, 1022.55, 1065.65
Support below: 1008.20
Nearest pivot: 1009.75
Above 1009.75 → 1010.65 next
Lose 1008.20 → open air
See the KOSPI 200 levels on Little Bird Trading
China: FTSE China A50
A recap of how the October 13th FTSE China A50 trading session and levels played out
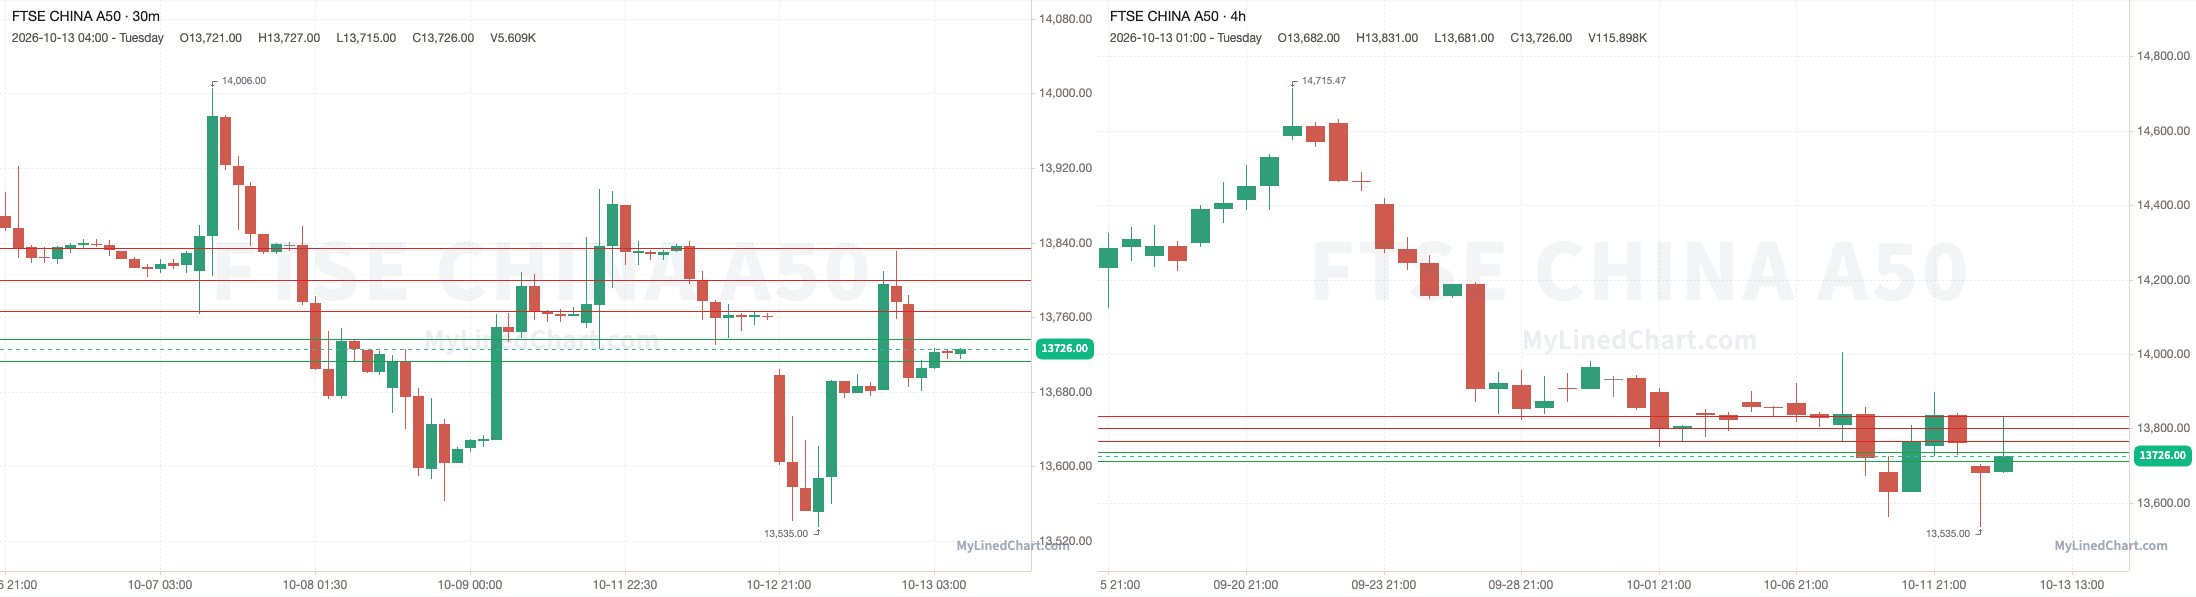
FTSE China A50 opened at 13698, broke above the 13767 pivot and ran up to tag 13800, with a high of 13831, then ended up closing at 13726. Finishing the trading session up 0.20% intraday.
October 13th session levels:
All listed levels: 13713, 13737, 13767, 13800, 13834
Resistance above: 13767, 13800, 13834
Support below: 13737, 13713
Nearest pivot: 13767
Above 13767 → 13800 next
Lose 13737 → 13713 next
See the FTSE China A50 levels on Little Bird Trading
Hong Kong: Hang Seng
A recap of how the October 13th Hang Seng trading session and levels played out
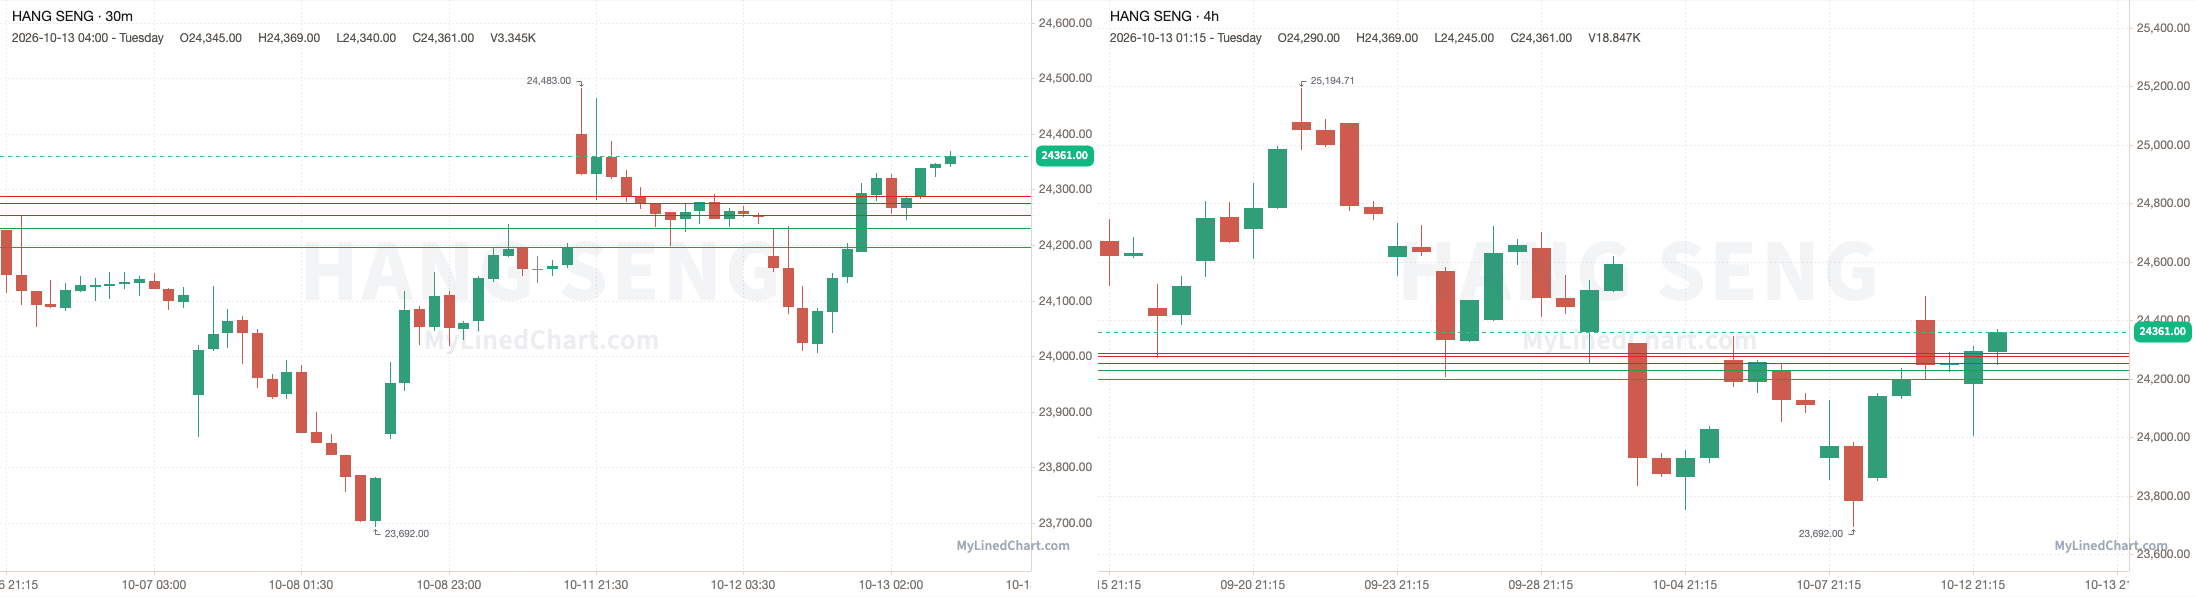
Hang Seng opened at 24180, broke above the 24254 pivot and ran through every resistance level up to 24289, and kept going to a high of 24369, then ended up closing at 24361. Finishing the trading session up 0.75% intraday.
October 13th session levels:
All listed levels: 24197, 24231, 24254, 24276, 24289
Resistance above: 24254, 24276, 24289
Support below: 24231, 24197
Nearest pivot: 24254
Above 24254 → 24276 next
Lose 24231 → 24197 next
See the Hang Seng levels on Little Bird Trading
Taiwan: FTSE Taiwan
A recap of how the October 13th FTSE Taiwan trading session and levels played out
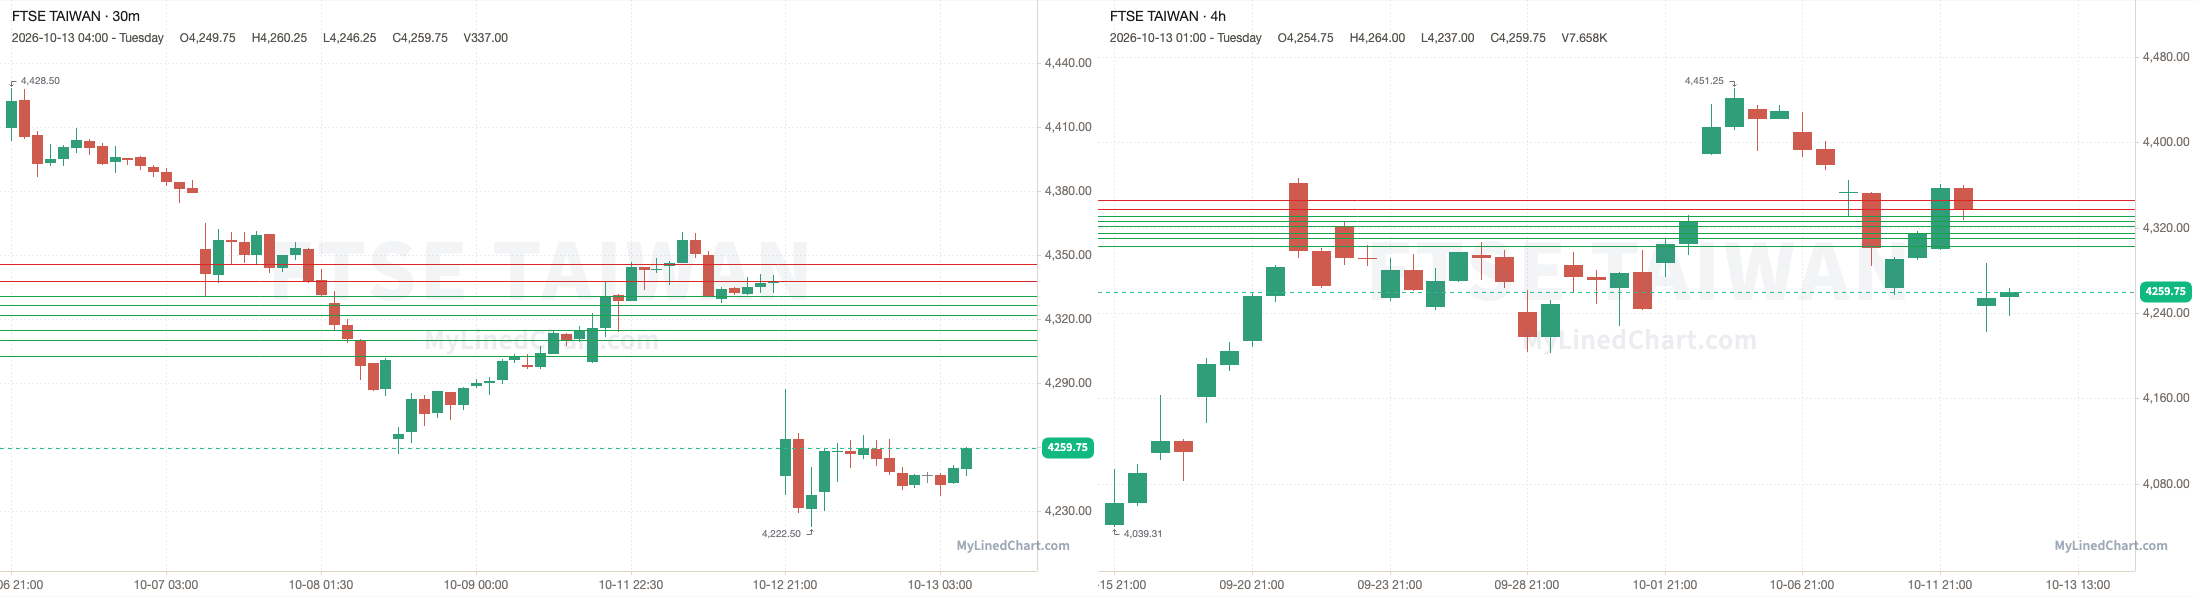
FTSE Taiwan opened at 4246.50, under the 4331 pivot and every level in the plan, and never traded back up to them, with a high of 4287.25 and a low of 4222.50, then ended up closing at 4259.75. Finishing the trading session up 0.31% intraday.
October 13th session levels:
All listed levels: 4302.75, 4310.25, 4314.75, 4322, 4326.50, 4331, 4338, 4346
Resistance above: 4338, 4346
Support below: 4331, 4326.50, 4322, 4314.75, 4310.25, 4302.75
Nearest pivot: 4331
Above 4338 → 4346 next
Lose 4331 → 4326.50 next
See the FTSE Taiwan levels on Little Bird Trading
Singapore: MSCI Singapore
A recap of how the October 13th MSCI Singapore trading session and levels played out
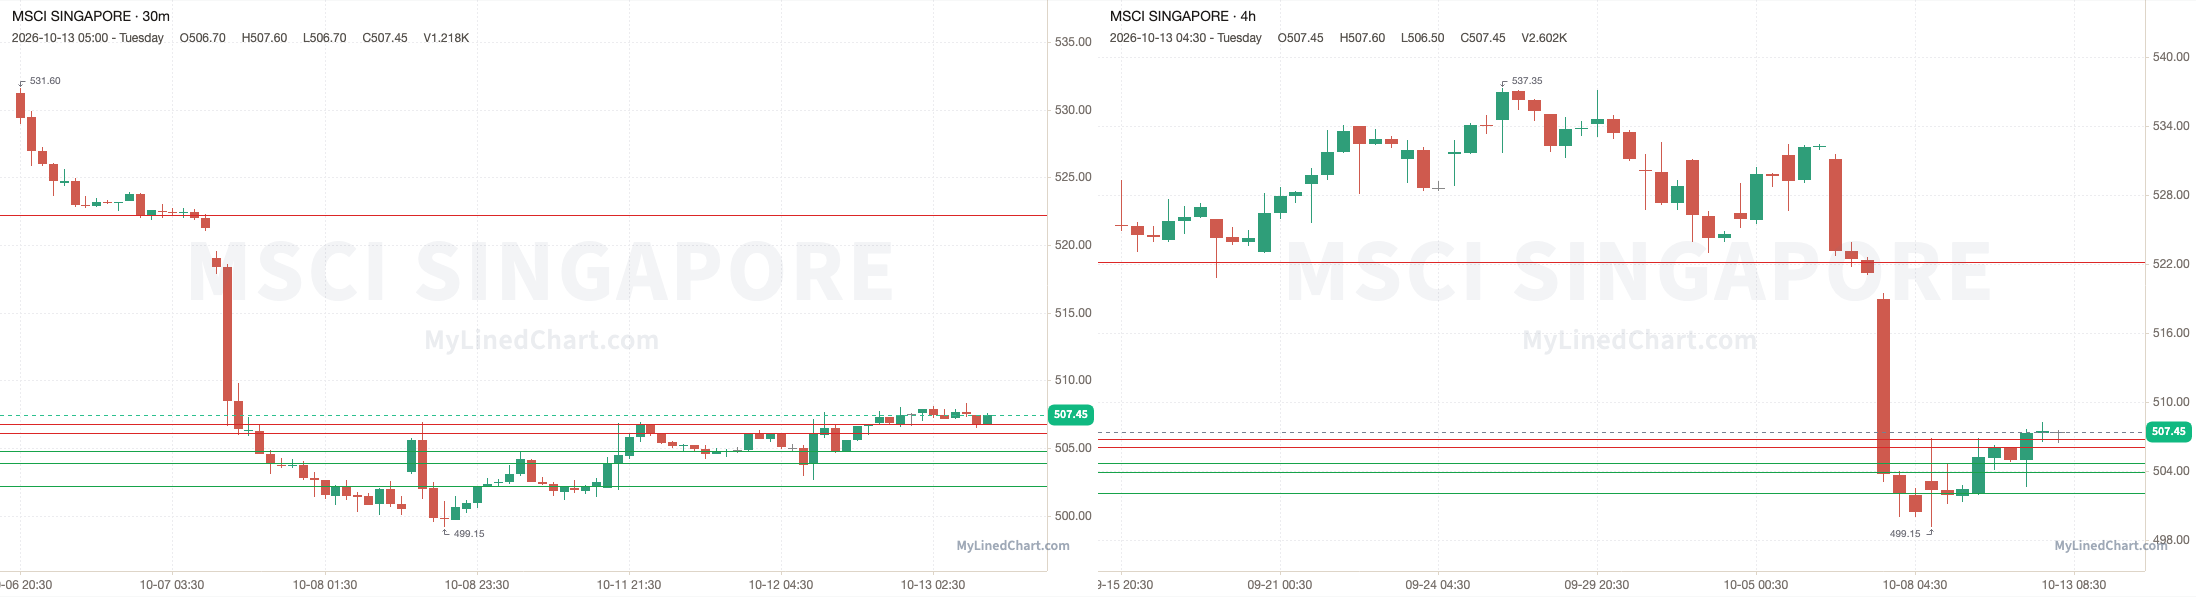
MSCI Singapore opened at 505, dipped below the 504.75 pivot to a low of 502.65, then reclaimed it and ran up to tag 506.80, with a high of 508.30, then ended up closing at 507.45. Finishing the trading session up 0.49% intraday.
October 13th session levels:
All listed levels: 502.15, 503.90, 504.75, 506.10, 506.80, 522.20
Resistance above: 506.10, 506.80, 522.20
Support below: 504.75, 503.90, 502.15
Nearest pivot: 504.75
Above 506.10 → 506.80 next
Lose 504.75 → 503.90 next
See the MSCI Singapore levels on Little Bird Trading
India: NIFTY 50
A recap of how the October 13th NIFTY 50 trading session and levels played out
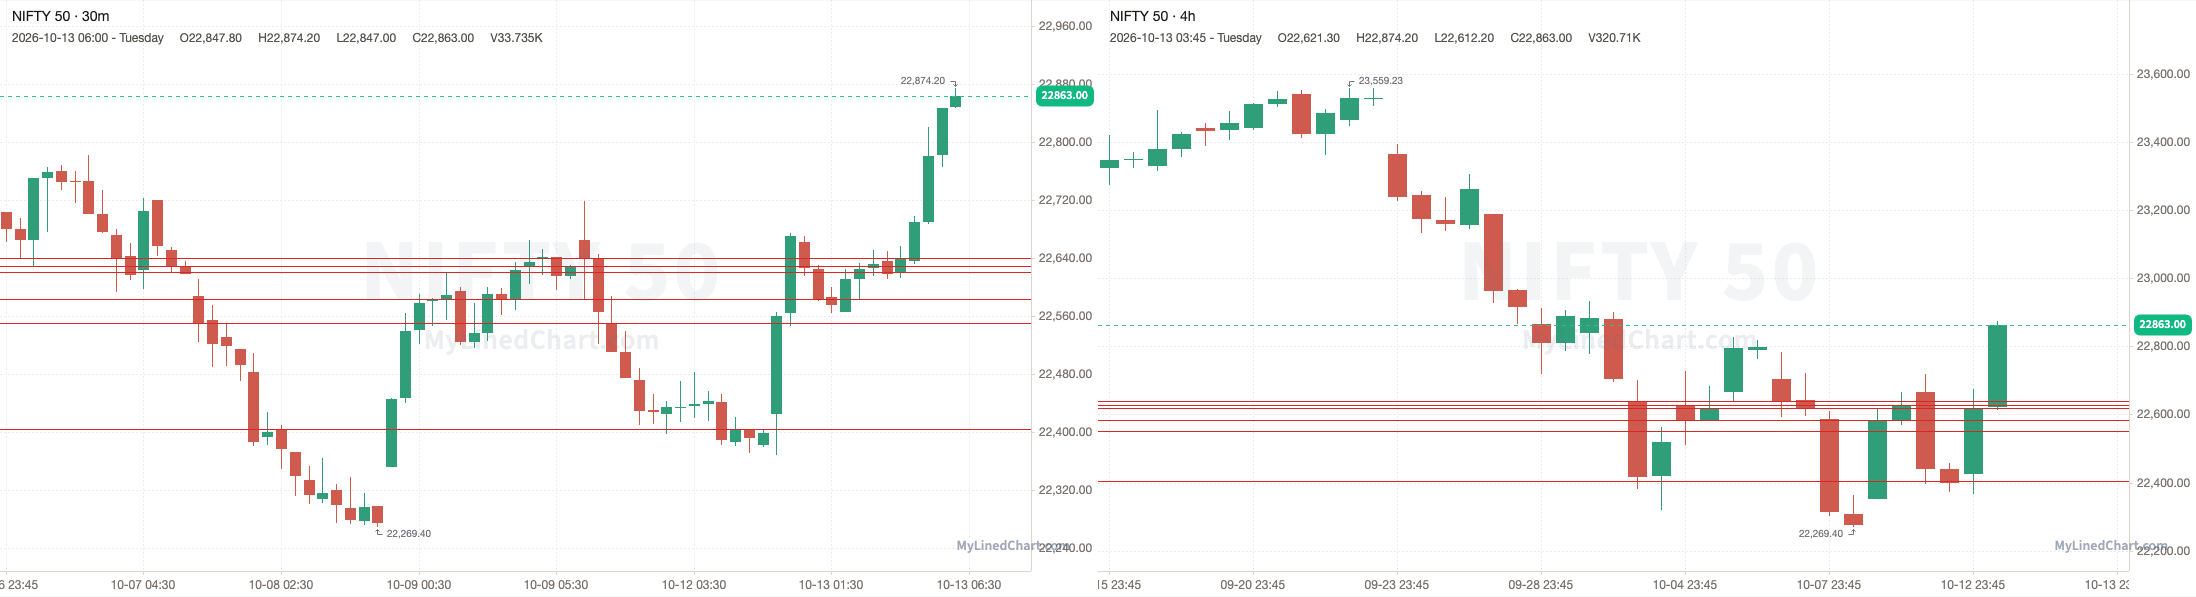
NIFTY opened at 22425, dipped below the 22404.10 pivot to a low of 22368, then reclaimed it and ran through every resistance level up to 22640, and kept going to a high of 22874.20, then ended up closing at 22863. Finishing the trading session up 1.95% intraday and up 2.07% overall.
October 13th session levels:
All listed levels: 22404.10, 22550.10, 22584.10, 22620, 22629, 22640
Resistance above: 22404.10, 22550.10, 22584.10, 22620, 22629, 22640
Support below: none
Nearest pivot: 22404.10
Above 22404.10 → 22550.10 next
See the NIFTY 50 levels on Little Bird Trading
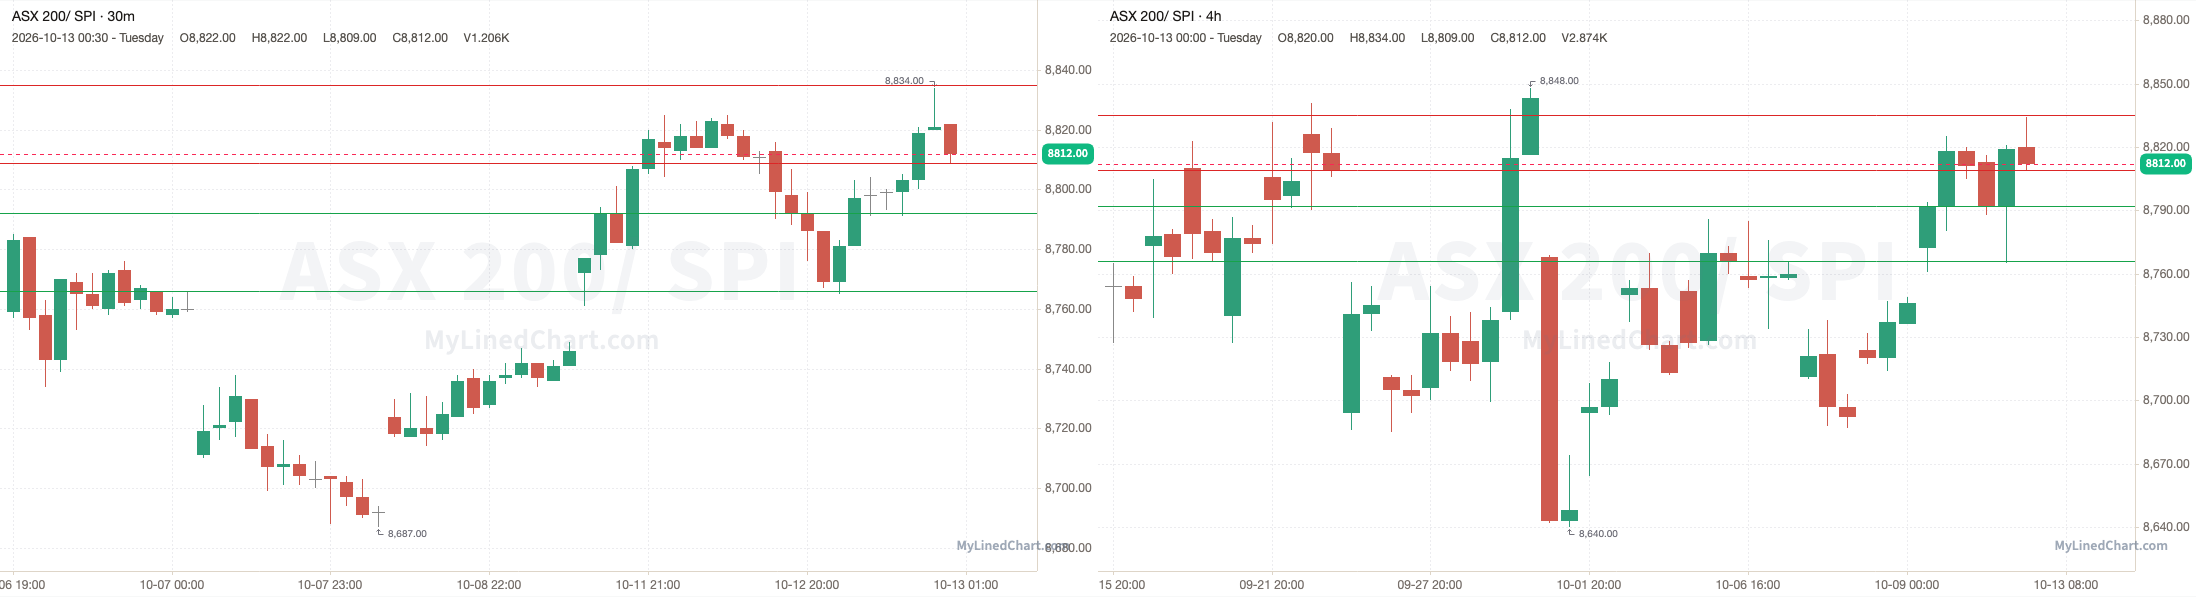
Australia: SPI
A recap of how the October 13th SPI trading session and levels played out
SPI opened at 8813, broke below the 8792 pivot and ran through every support level down to 8766, and kept going to a low of 8765, then ended up closing at 8812. Finishing the trading session down 0.01% intraday and up 0.01% overall.
October 13th session levels:
All listed levels: 8766, 8792, 8809, 8835
Resistance above: 8809, 8835
Support below: 8792, 8766
Nearest pivot: 8792
Above 8809 → 8835 next
Lose 8792 → 8766 next
See the SPI levels on Little Bird Trading
Europe
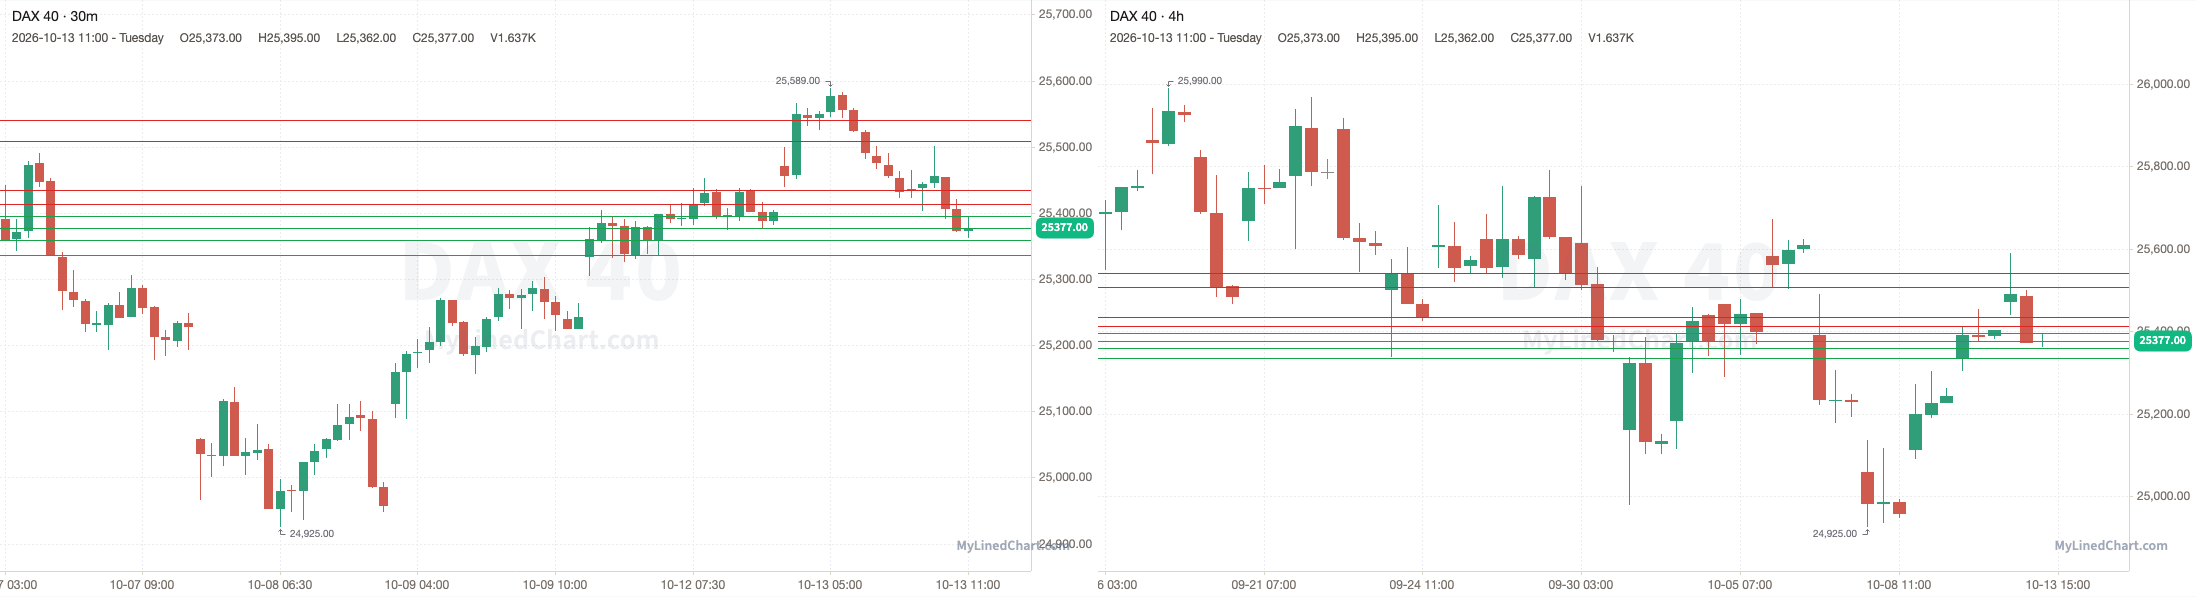
Germany: DAX 40
A recap of how the October 13th DAX 40 trading session and levels played out
DAX 40 opened at 25471, broke below the 25395 pivot and dropped to tag 25377, with a low of 25362, then ended up closing at 25377. Finishing the trading session down 0.37% intraday.
October 13th session levels:
All listed levels: 25336, 25359, 25377, 25395, 25413, 25435, 25508, 25541
Resistance above: 25413, 25435, 25508, 25541
Support below: 25395, 25377, 25359, 25336
Nearest pivot: 25395
Above 25413 → 25435 next
Lose 25395 → 25377 next
See the DAX 40 levels on Little Bird Trading
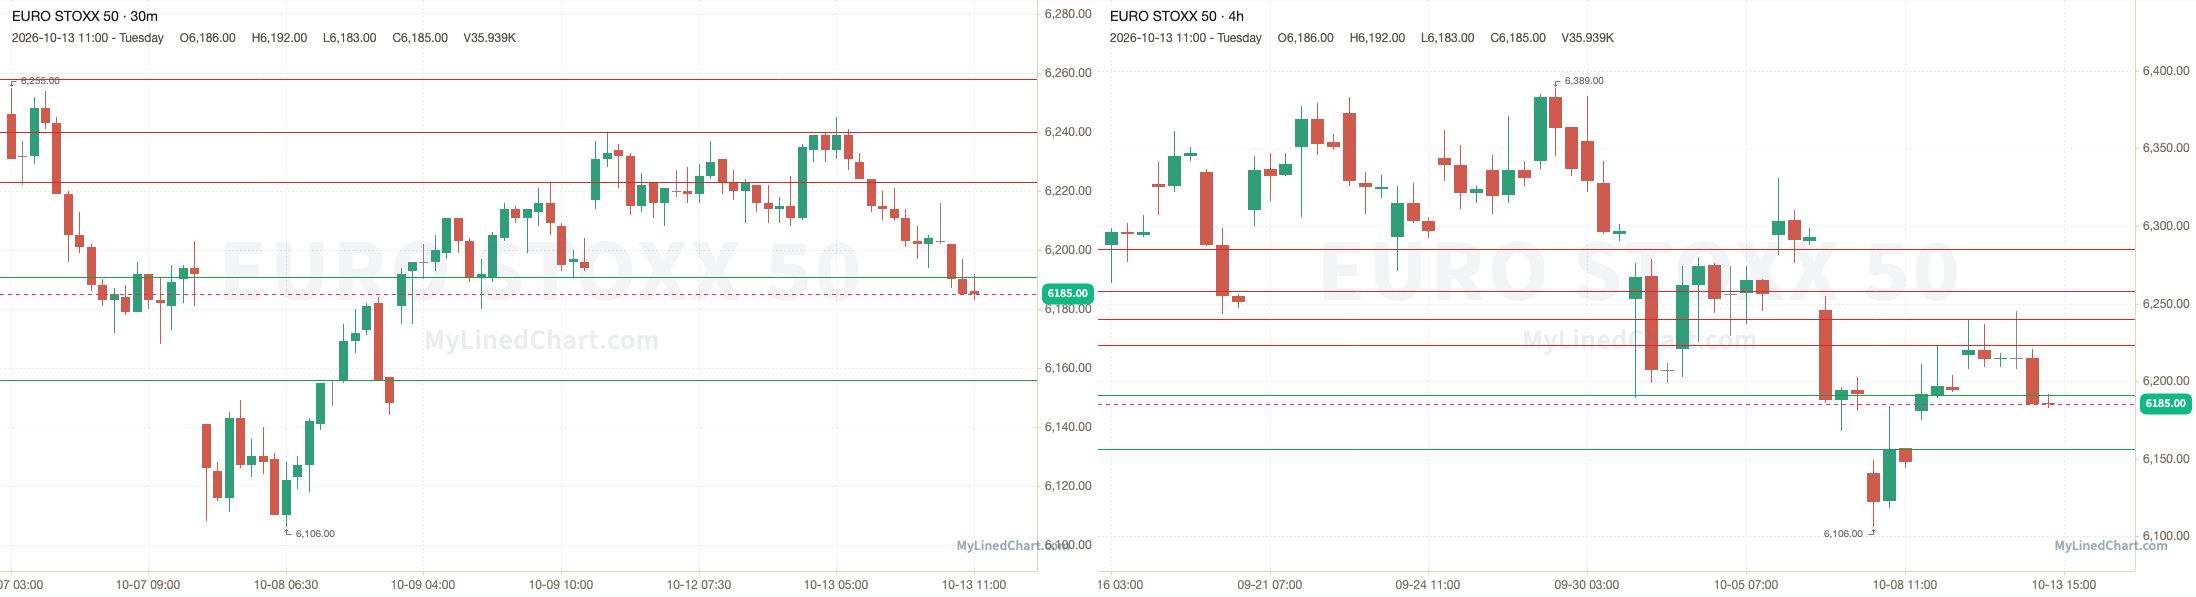
Eurozone: Euro Stoxx 50
A recap of how the October 13th Euro Stoxx 50 trading session and levels played out
Euro Stoxx 50 opened at 6215, popped above the 6223 pivot to a high of 6245, then lost it and dropped to tag 6191, with a low of 6183, then ended up closing at 6185. Finishing the trading session down 0.48% intraday.
October 13th session levels:
All listed levels: 6156, 6191, 6223, 6240, 6258, 6285
Resistance above: 6223, 6240, 6258, 6285
Support below: 6191, 6156
Nearest pivot: 6223
Above 6223 → 6240 next
Lose 6191 → 6156 next
See the Euro Stoxx 50 levels on Little Bird Trading
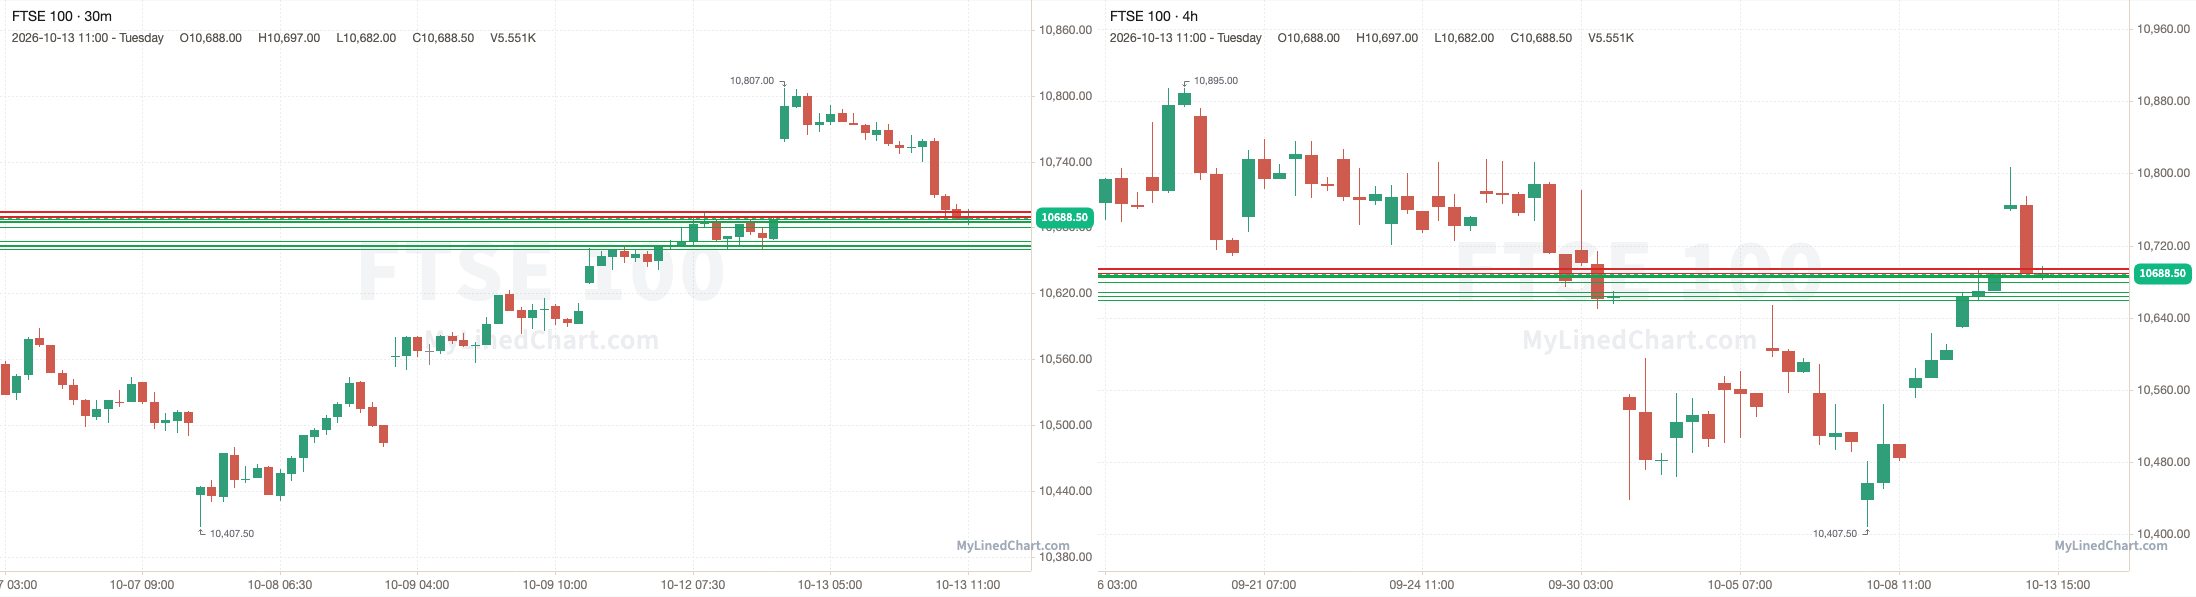
UK: FTSE 100
A recap of how the October 13th FTSE 100 trading session and levels played out
FTSE 100 opened at 10760.50, broke below the 10687.46 pivot and dropped to tag 10684.58, with a low of 10682, then ended up closing at 10688.50. Finishing the trading session down 0.67% intraday.
October 13th session levels:
All listed levels: 10660, 10663.50, 10664, 10668, 10680.05, 10684.58, 10685.44, 10686.08, 10687.46, 10689.10, 10690, 10694.14, 10694.64
Resistance above: 10689.10, 10690, 10694.14, 10694.64
Support below: 10687.46, 10686.08, 10685.44, 10684.58, 10680.05, 10668, 10664, 10663.50, 10660
Nearest pivot: 10687.46
Above 10689.10 → 10690 next
Lose 10687.46 → 10686.08 next
See the FTSE 100 levels on Little Bird Trading
France: CAC 40
A recap of how the October 13th CAC 40 trading session and levels played out
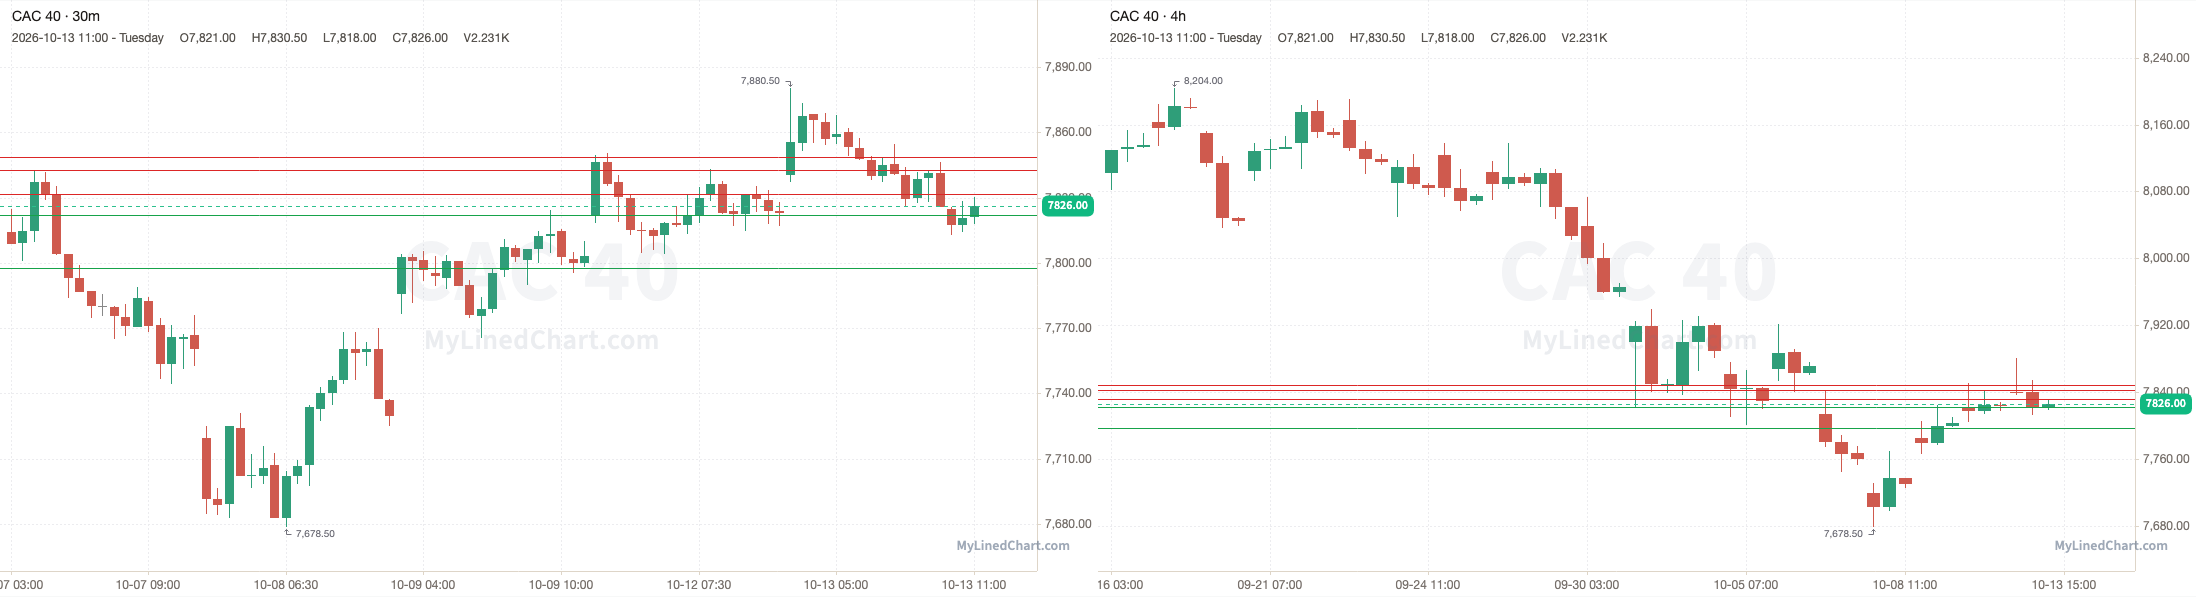
CAC 40 opened at 7840.50, broke below the 7822 pivot and dropped to a low of 7813, then ended up closing at 7826. Finishing the trading session down 0.18% intraday.
October 13th session levels:
All listed levels: 7797.50, 7822, 7831.50, 7842.50, 7848.50
Resistance above: 7831.50, 7842.50, 7848.50
Support below: 7822, 7797.50
Nearest pivot: 7822
Above 7831.50 → 7842.50 next
Lose 7822 → 7797.50 next
See the CAC 40 levels on Little Bird Trading
Spain: IBEX 35
A recap of how the October 13th IBEX 35 trading session and levels played out
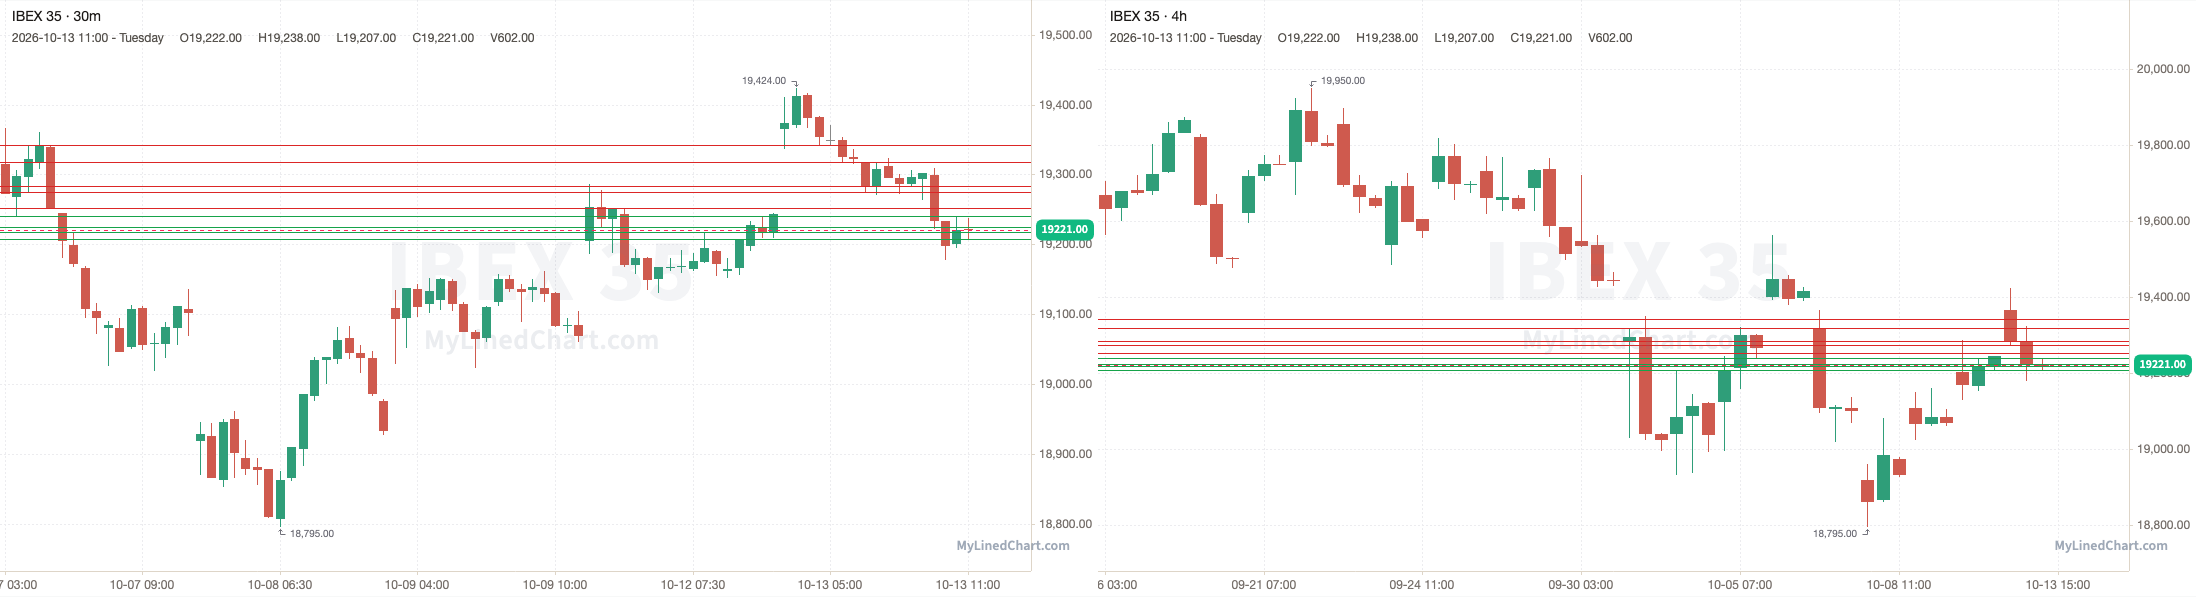
IBEX 35 opened at 19365, broke below the 19240 pivot and ran through every support level down to 19207, and kept going to a low of 19178, then ended up closing at 19221. Finishing the trading session down 0.74% intraday.
October 13th session levels:
All listed levels: 19207, 19218, 19225, 19240, 19252, 19275, 19284, 19318, 19342
Resistance above: 19252, 19275, 19284, 19318, 19342
Support below: 19240, 19225, 19218, 19207
Nearest pivot: 19240
Above 19252 → 19275 next
Lose 19240 → 19225 next
See the IBEX 35 levels on Little Bird Trading
Italy: FTSE MIB
A recap of how the October 13th FTSE MIB trading session and levels played out
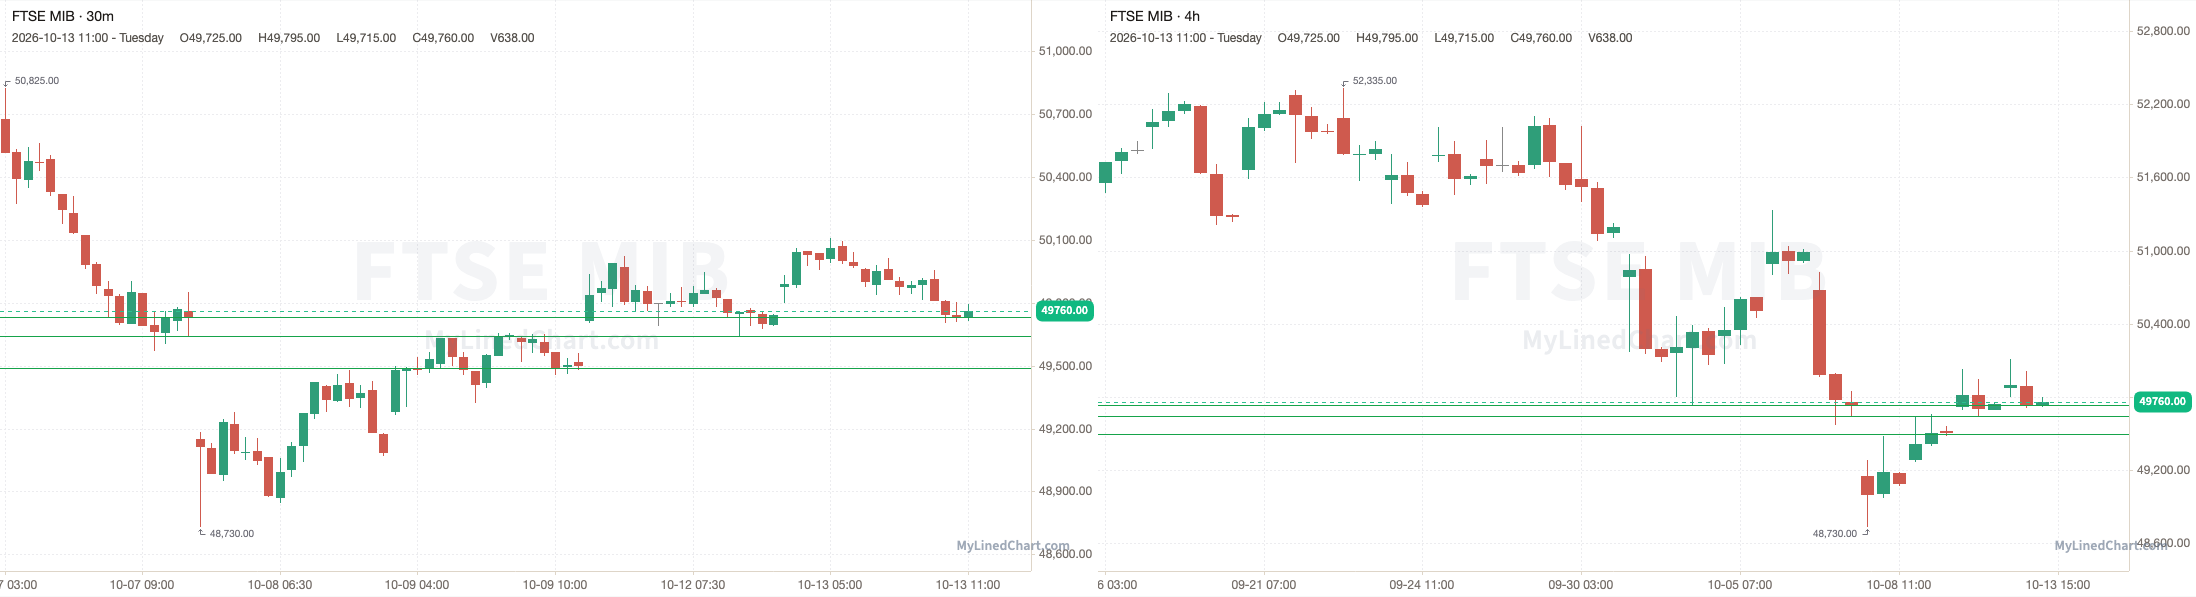
FTSE MIB opened at 49875, broke below the 49730 pivot and dropped to a low of 49705, then ended up closing at 49760. Finishing the trading session down 0.23% intraday.
October 13th session levels:
All listed levels: 49490, 49640, 49730
Resistance above: none
Support below: 49730, 49640, 49490
Nearest pivot: 49730
Lose 49730 → 49640 next
See the FTSE MIB levels on Little Bird Trading
Netherlands: AEX
A recap of how the October 13th AEX trading session and levels played out
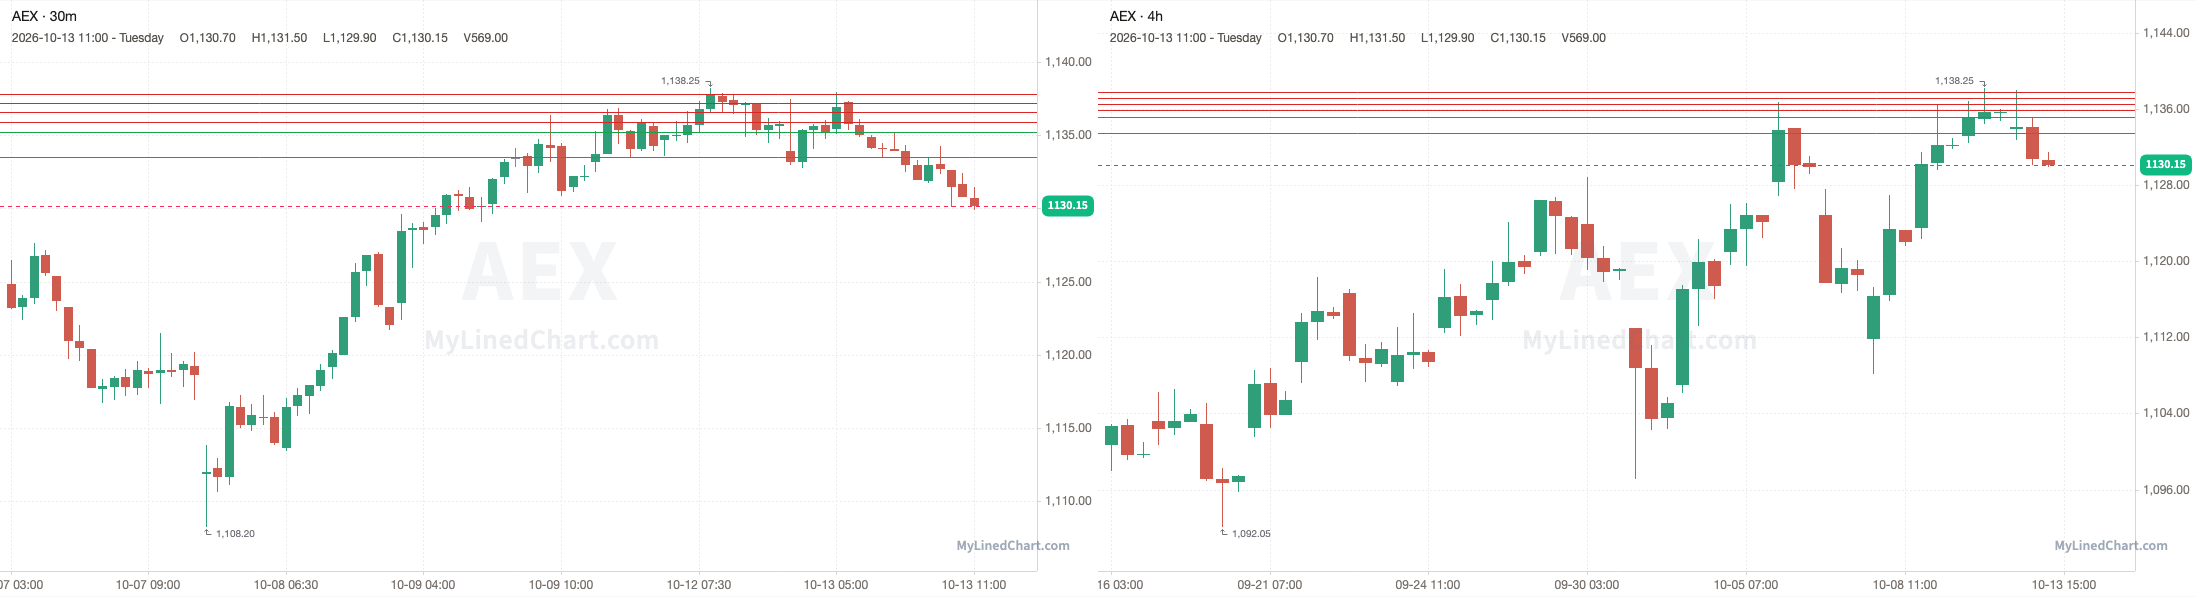
AEX opened at 1133.90, popped above the 1135.90 pivot to a high of 1138, then lost it and dropped to tag 1133.55, with a low of 1129.90, then ended up closing at 1130.15. Finishing the trading session down 0.33% intraday.
October 13th session levels:
All listed levels: 1133.55, 1135.20, 1135.90, 1136.60, 1137.20, 1137.80
Resistance above: 1135.90, 1136.60, 1137.20, 1137.80
Support below: 1135.20, 1133.55
Nearest pivot: 1135.90
Above 1135.90 → 1136.60 next
Lose 1135.20 → 1133.55 next
See the AEX levels on Little Bird Trading
Sweden: OMXS30
A recap of how the October 13th OMXS30 trading session and levels played out
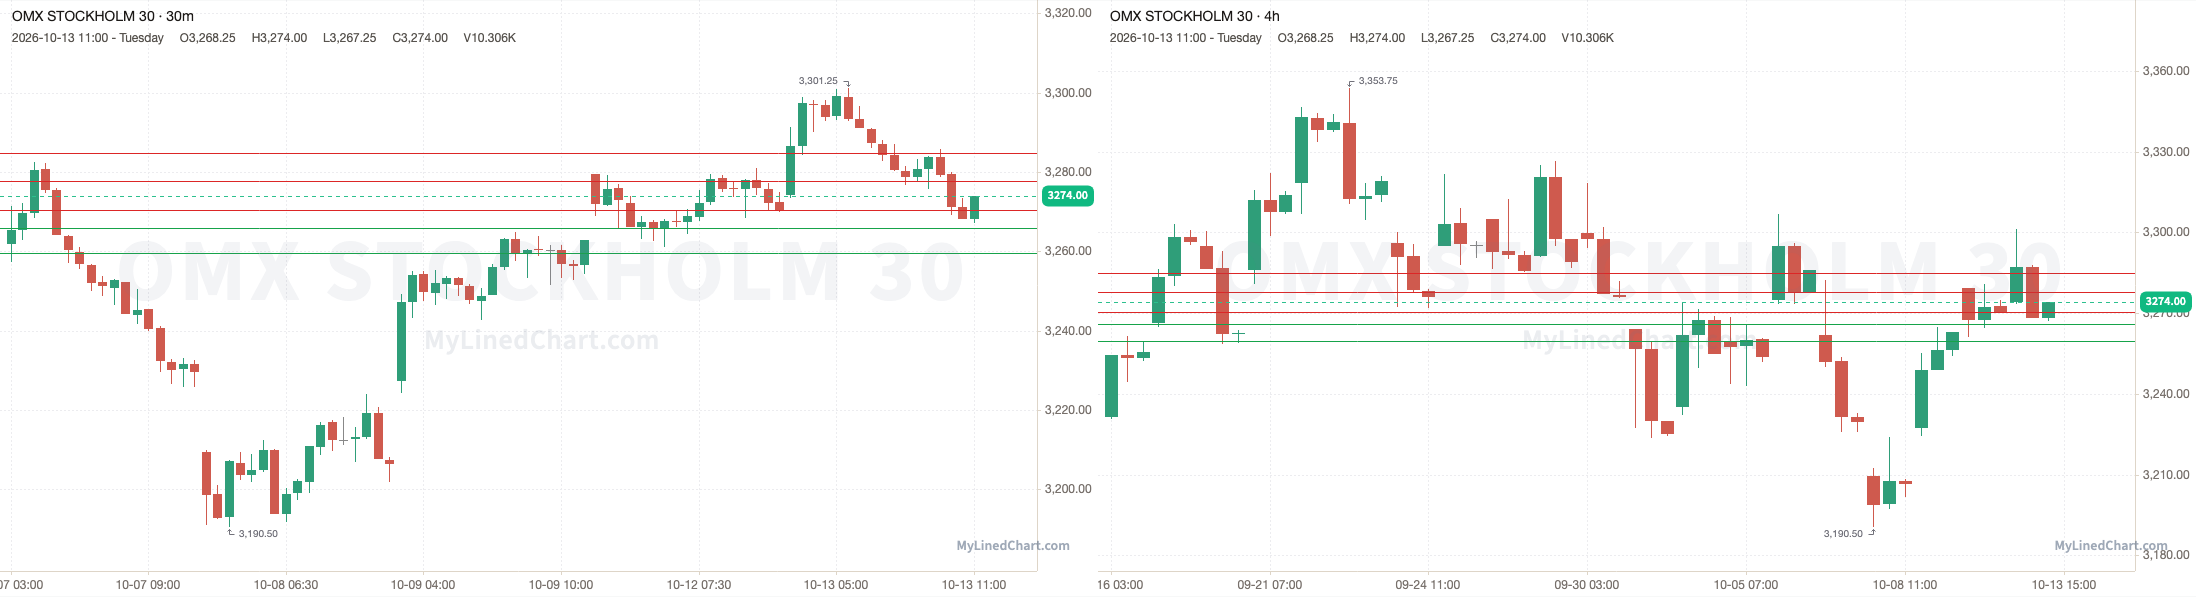
OMXS30 opened at 3274.25, broke below the 3270.50 pivot and dropped to a low of 3267.25, then ended up closing at 3274. Finishing the trading session down 0.01% intraday.
October 13th session levels:
All listed levels: 3259.50, 3266, 3270.50, 3277.75, 3284.75
Resistance above: 3270.50, 3277.75, 3284.75
Support below: 3266, 3259.50
Nearest pivot: 3270.50
Above 3270.50 → 3277.75 next
Lose 3266 → 3259.50 next
See the OMXS30 levels on Little Bird Trading
Switzerland: SMI
A recap of how the October 13th SMI trading session and levels played out
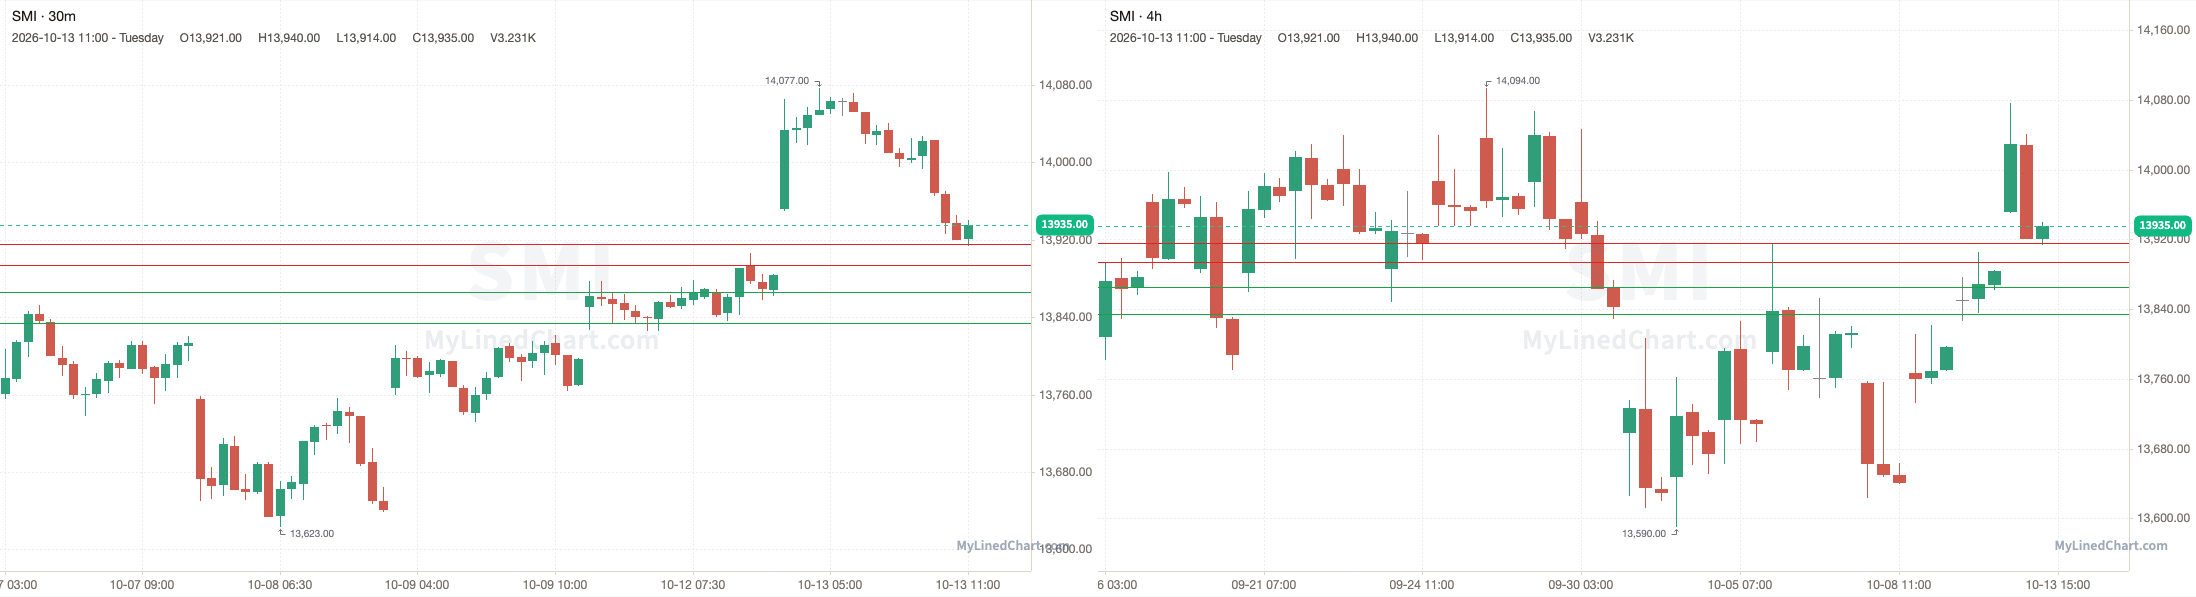
SMI opened at 13952, held above the 13894 pivot and dropped to a low of 13914, then ended up closing at 13935. Finishing the trading session down 0.12% intraday.
October 13th session levels:
All listed levels: 13834, 13866, 13894, 13916
Resistance above: 13894, 13916
Support below: 13866, 13834
Nearest pivot: 13894
Above 13894 → 13916 next
Lose 13866 → 13834 next
See the SMI levels on Little Bird Trading
Latin America
Mexico: S&P/BMV IPC
A recap of how the October 13th S&P/BMV IPC trading session and levels played out
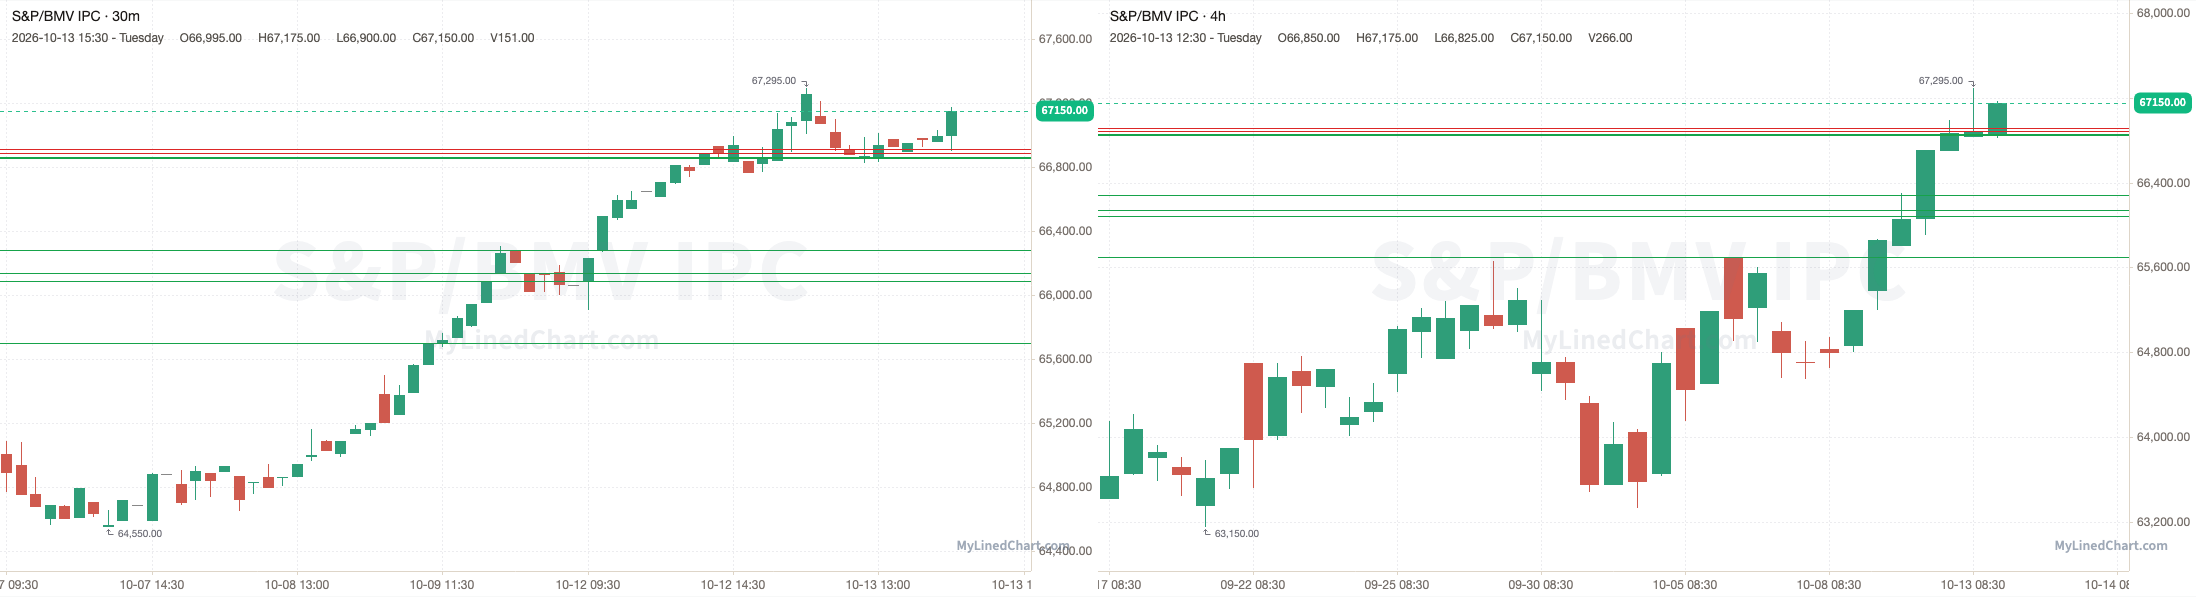
S&P/BMV IPC opened at 66835, broke above the 66864 pivot and ran through every resistance level up to 66915, and kept going to a high of 67295, then ended up closing at 67150. Finishing the trading session up 0.47% intraday.
October 13th session levels:
All listed levels: 65700, 66086, 66139, 66280, 66854, 66864, 66890, 66915
Resistance above: 66890, 66915
Support below: 66864, 66854, 66280, 66139, 66086, 65700
Nearest pivot: 66864
Above 66890 → 66915 next
Lose 66864 → 66854 next
See the S&P/BMV IPC levels on Little Bird Trading
Brazil: Ibovespa
No Ibovespa review available today.
See the Ibovespa levels on Little Bird Trading
Disclaimer: Little Bird Trading and any of its associations may or may not, whether long or short, have a position in any instruments. Not investment advice. Provided for informational purposes only. Not a recommendation or endorsement. Not registered or licensed. Model portfolios are property of their respective owners. All data is sourced from publicly available information. No guarantee is being made or offered. Not responsible for financial loss or ruin. Little Bird Trading may earn a commission if you purchase through links on the site.
Day Trade Levels for the October 14th Trading Session:
Enjoying this content?
Subscribe on Substack