

Using Codex or Claude Code With IBKR Chart Data
Use Codex or Claude Code with IBKR chart data by giving AI tools structured exports, field definitions, and narrow tasks a human can review.
Note: this article was originally published on MyLinedChart. Get your 1st week free.
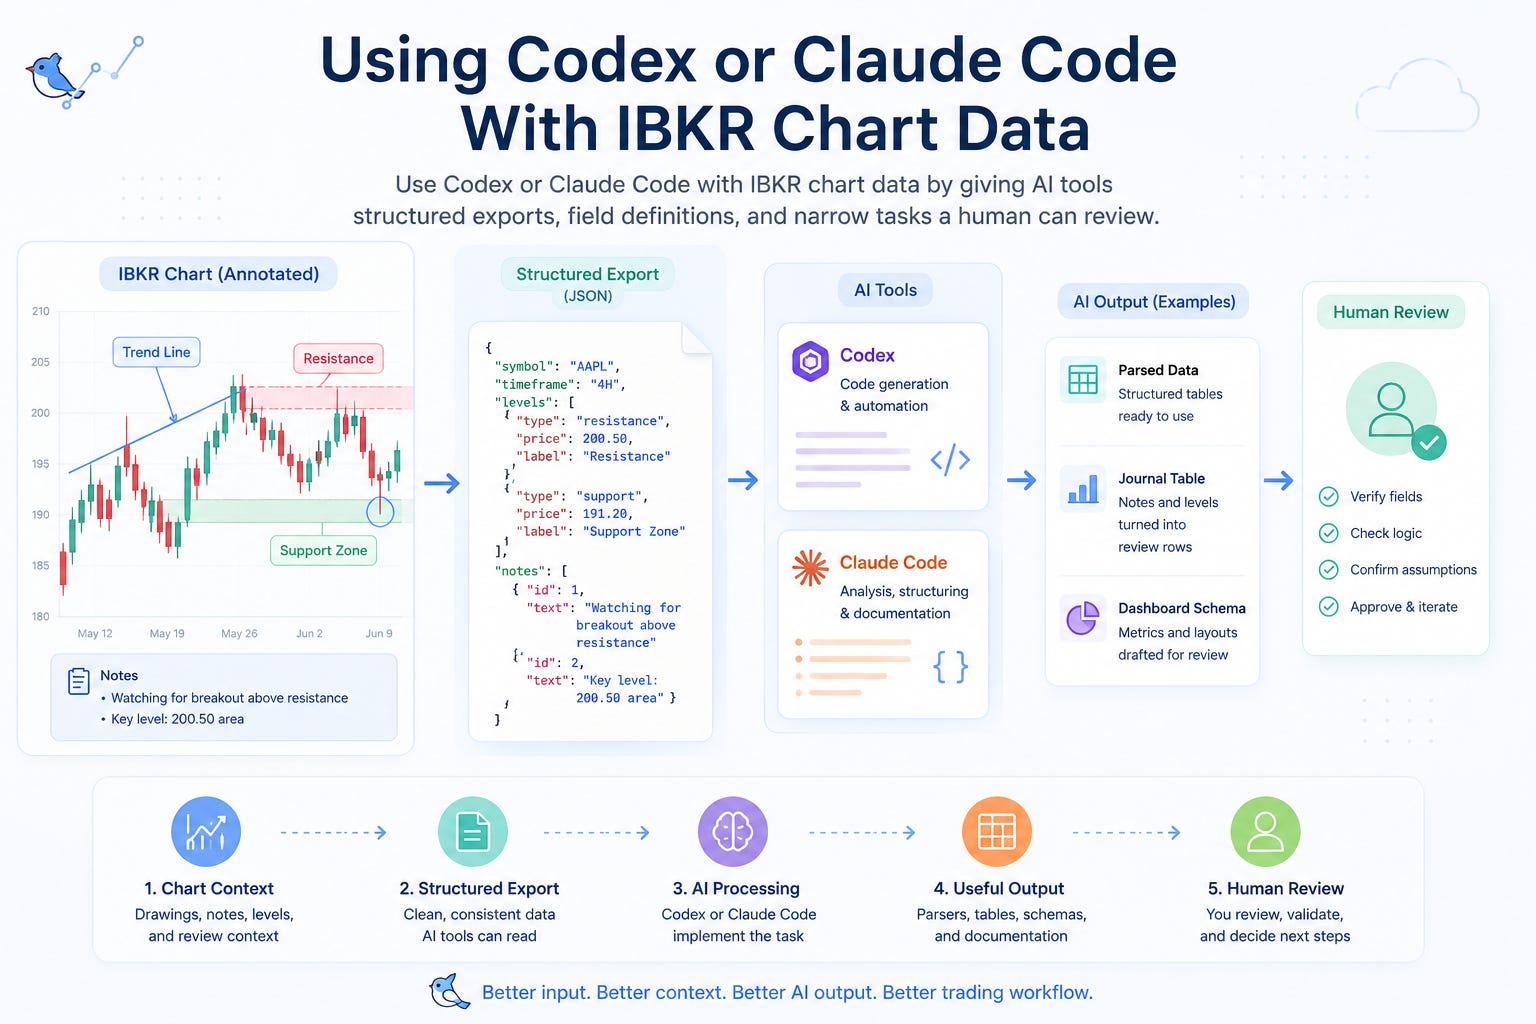
Codex and Claude Code are useful when the input is specific. For IBKR chart workflows, that means structured chart context: drawings, notes, levels, symbols, timeframes, review fields, and a clear task that does not ask the AI to make trading decisions.
Key Takeaways
Give AI tools structured chart exports and field definitions, not vague screenshots.
Ask for narrow implementation outputs such as parsers, tables, documentation, and dashboard drafts.
Keep strategy judgment, trade approval, and final workflow acceptance under human control.
Quick Answer
The best way to use Codex or Claude Code with IBKR chart data is to give the AI a clean input and a narrow job. Do not ask it to build a trading system from a screenshot. Give it a sample export, explain the fields, define the output you want, and tell it what assumptions are not allowed.
Good AI tasks include parsing exports, creating journal tables, drafting dashboard schemas, checking for missing fields, and writing workflow documentation. Bad AI tasks include deciding whether to trade, changing risk rules without review, or inventing missing market context.
What AI Tools Can Actually Help With
Use AI for implementation support, not trading authority.
Task Good Use Human Check
Parser Read export files and normalize fields Verify fields match the actual export
Journal table Turn notes and levels into review rows Confirm labels match your trading process
Dashboard draft Create metrics and mock tables Approve definitions before relying on them
Schema review Find missing or ambiguous fields Decide which fields matter operationally
Documentation Explain the handoff between chart, export, and review Remove unsupported assumptions
The Input AI Needs
AI tools perform better when the chart context is exported as structured data. That gives the model inspectable fields instead of forcing it to guess from a visual artifact.
For IBKR chart workflows, the minimum useful input is not just price data. It is the decision context around the chart.
The better the input contract, the easier the output is to review.
Input Why It Matters
Symbol and timeframe Keeps the workflow tied to the reviewed market context
Drawn levels and zones Shows where the trader expected decisions to happen
Notes and labels Preserves setup intent and review language
Session or review status Separates active ideas from archived context
Export timestamp Makes comparisons and updates auditable
Desired output Keeps Codex or Claude Code focused on one job
Prompt Pattern
Use a prompt with five parts: context, sample data, field definitions, task, and review rules. This keeps the AI from drifting into advice or unsupported assumptions.
Example: Here is a sample MyLinedChart export from my IBKR chart workflow. Explain each field, identify missing review data, and draft a TypeScript parser that groups notes by setup tag. Do not infer trading advice. Do not create fields that are not present unless you list them as recommendations.
A good prompt makes the AI output easier to inspect.
Prompt Part What to Include
Context IBKR chart review, journal, dashboard, or automation planning
Sample data A real or sanitized export with representative fields
Field definitions What each note, level, tag, and status means
Task Parser, table, dashboard schema, documentation, or QA checklist
Review rule No trading advice, no hidden assumptions, and human approval required
Human Review Checklist
Before using any AI-generated workflow, review it like production code. The goal is not to be impressed by the output. The goal is to decide whether the output is accurate, narrow, and safe enough to keep improving.
Does the output use only fields that exist in the export?
Are missing fields listed as recommendations instead of invented facts?
Can a human trace each output row back to the chart context?
Does the workflow avoid trading advice and strategy claims?
Is the next action small enough to test safely?
Where MyLinedChart Fits
MyLinedChart gives Codex and Claude Code a better starting point by turning chart work into structured context. Drawings, notes, levels, symbols, timeframes, and review fields become data the AI can inspect instead of a screenshot it has to interpret loosely.
That makes the AI workflow more useful and easier to control. The trader still owns the logic, the review, and the final decision, but the implementation work becomes faster to document, test, and connect.
What Not to Ask
Do not ask Codex or Claude Code to decide whether a trade is good. Do not ask it to create a risk plan from incomplete context. Do not let it rewrite your process without a human review step.
The safer pattern is simple: AI drafts the implementation support, the trader approves the workflow logic, and any trading or risk decision remains outside the AI output.
Next Step
Start with one narrow workflow: export chart notes and levels, ask the AI to explain the fields, then have it draft one parser or journal table. Review the output by hand before expanding the workflow.
Use IBKR Automation & Integration if you need the full IBKR automation map, or Consulting if you want help defining the export schema and handoff document.
FAQ
Can Codex or Claude Code work with IBKR chart data?
Yes, if the chart data is structured. They work best with exports, field definitions, and narrow tasks such as parsing, documentation, dashboards, and review tables.
What should I avoid asking AI tools to do?
Avoid asking AI tools to make trading decisions, invent missing context, or approve risk changes. Use them for implementation support that a human can review.
What is the first workflow to test?
Start with a sample chart export and ask for a parser or journal table. Keep the first test small enough that every field and output can be checked manually.
This article was originally published on MyLinedChart. Get your 1st week free.
Enjoying this content?
Subscribe on Substack