

You put the "P" in the nice kids and a "C" in the naughty kids I Perch Observations #24
Simplifying the stock screening process I Weather Report covering futures, equity indices, stocks, bonds, commodities, currencies, and crypto I Disclaimers
Welcome to Little Bird Trading. My goal is to simplify your stock screening process so subscribers can own charts like this:
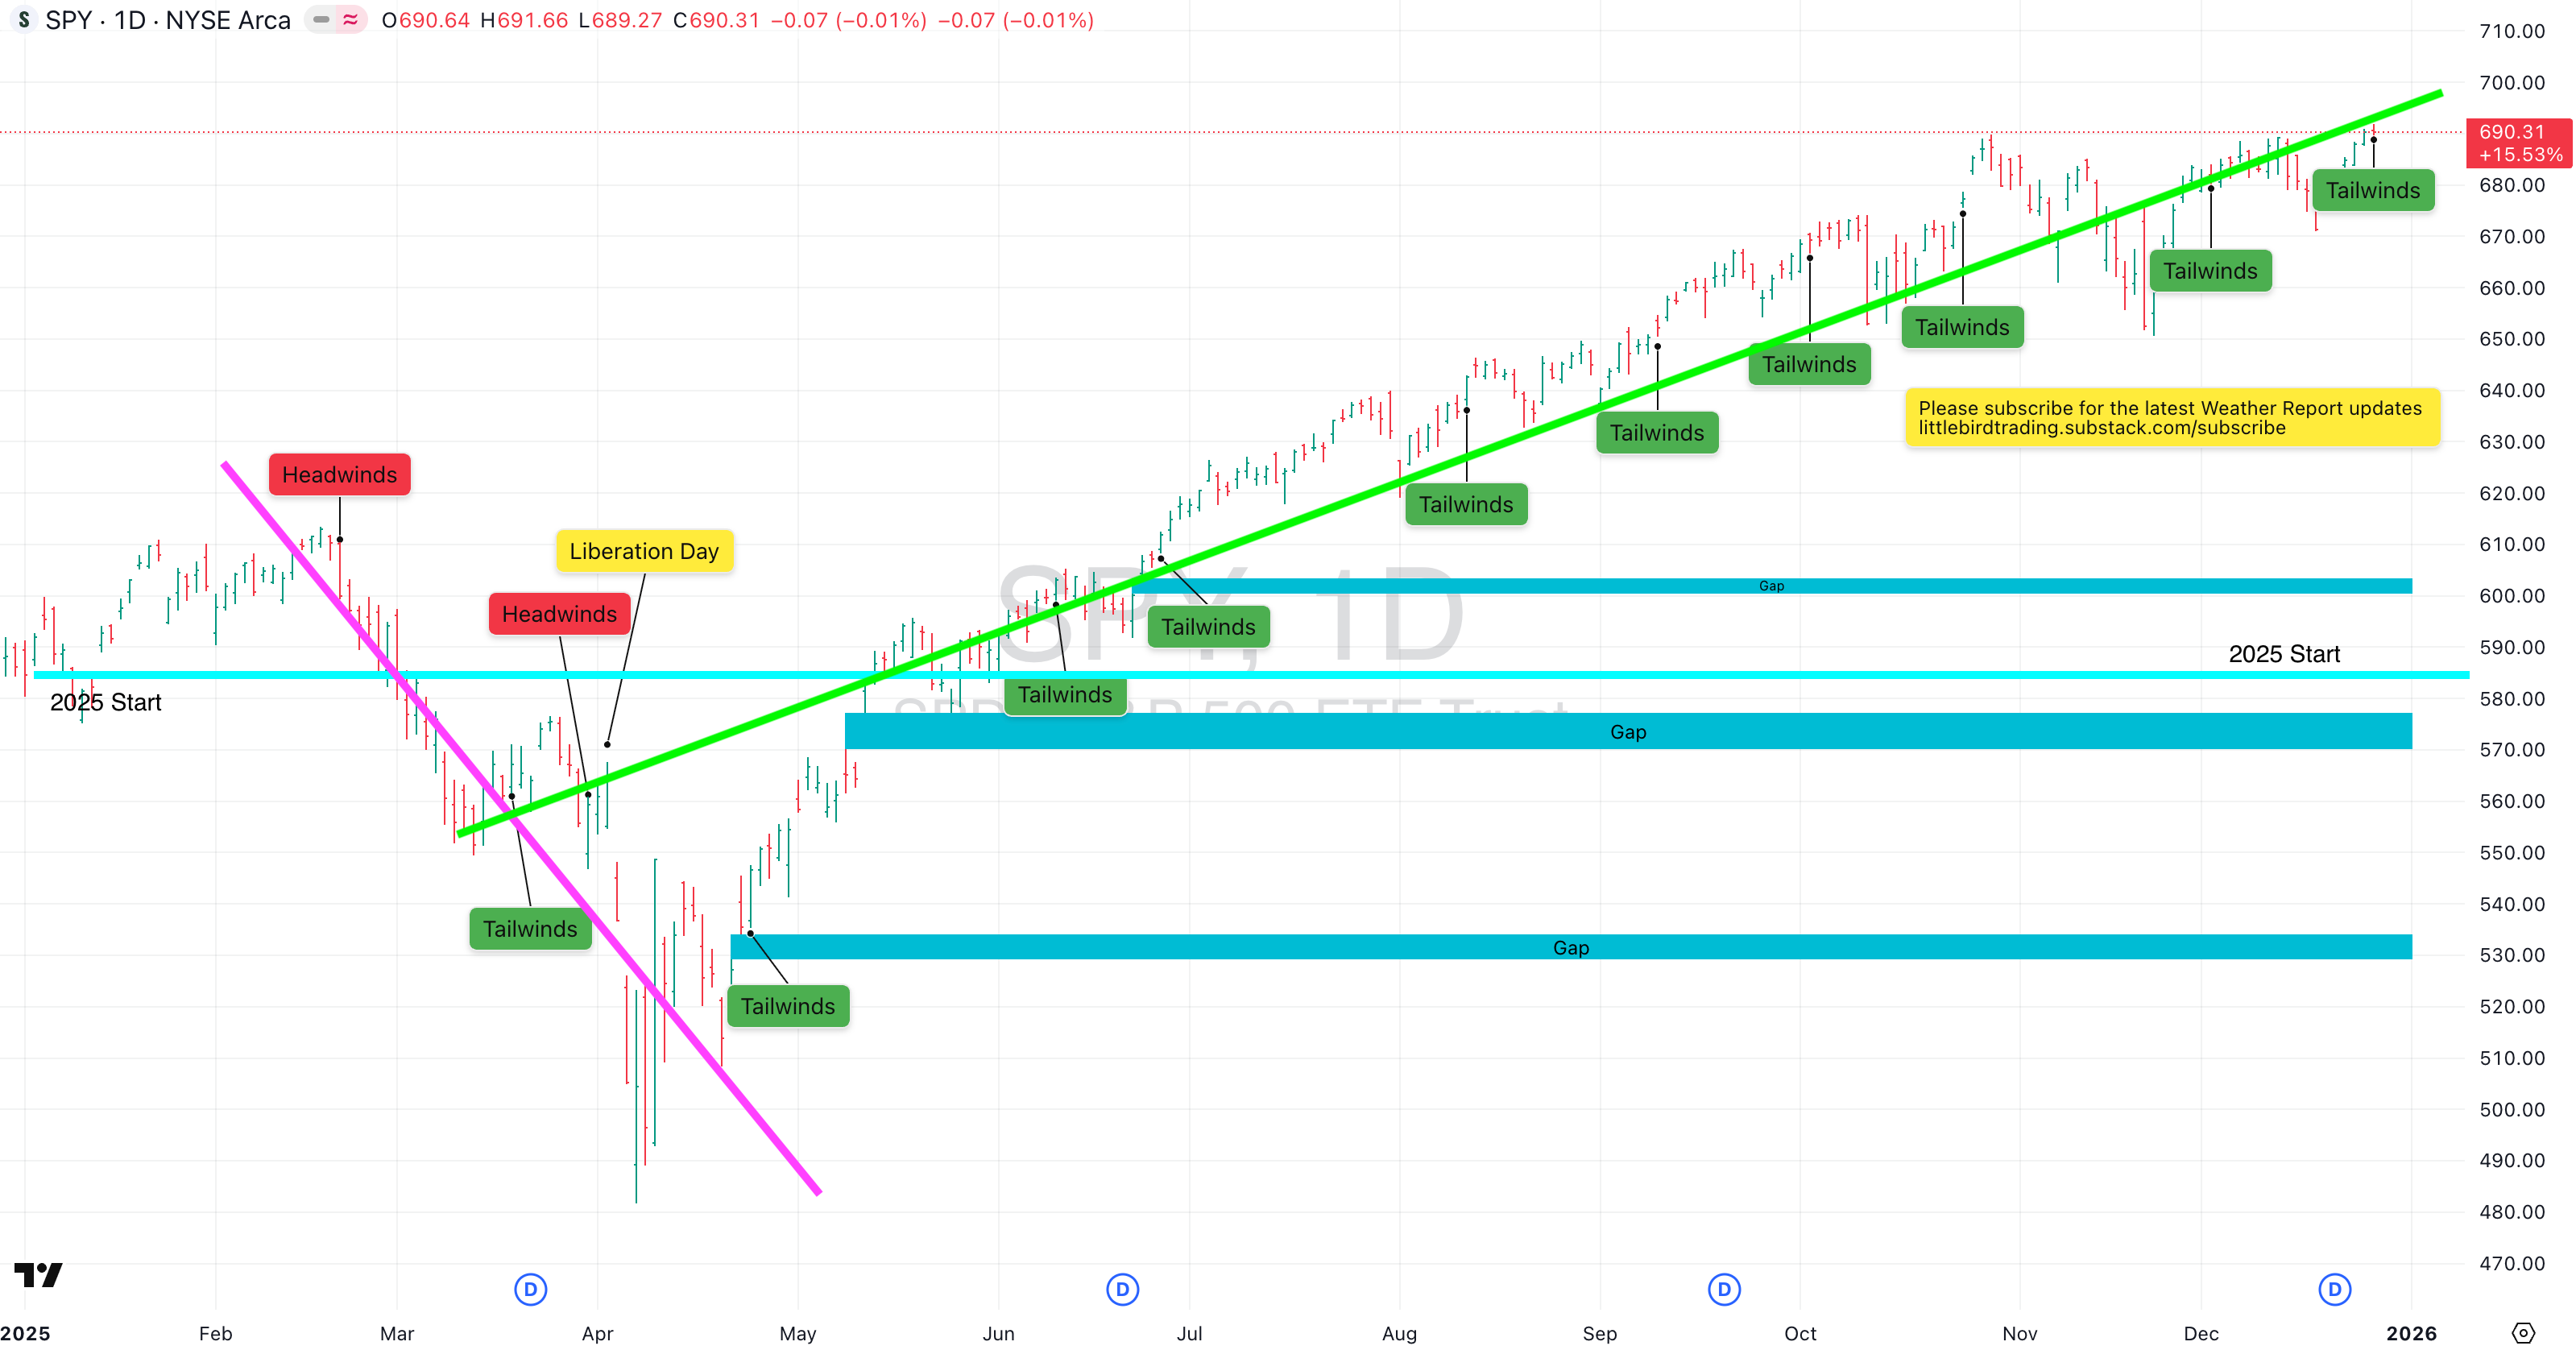
All Weather Reports cover two time frames:
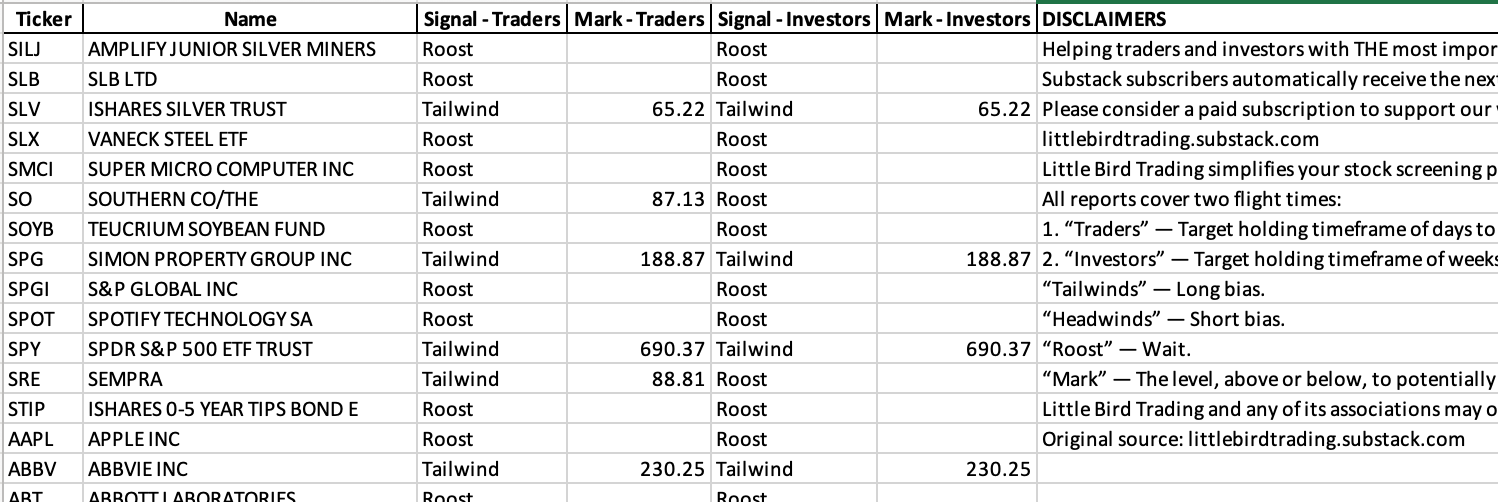
“Traders” — Target holding timeframe of days to weeks.
“Investors” — Target holding timeframe of weeks to months.
In seconds you can see actionable market intelligence:
“Tailwinds” — Long bias.
“Headwinds” — Short bias.
“Roost” — Wait.
“Mark” — The level, above or below, to potentially express your bias.
Not a recommendation or endorsement I Not investment advice
Subscribers can skip this section and jump to the paywall line for the latest. Free subscribers and everyone else, please subscribe to ensure you see the latest content when it’s published.

Below the paywall line in I'm Not A Cat. I Like The Spot. I Perch Observations #23 I shared the following charts and observations:
I’m Not A Cat. I Like The Spot.
Along with Adam Mancini, Jeff deGraaf at Renaissance Macro Research is one of the best chart readers out there:
The problem with a bubble, and this is why we identified it, is usually, technically, and when I say usually, I’d say 80%, 85%, if I’m gonna have a top, if I’m gonna transition from a bull market to a bear market, it’s not gonna be a V-top. You don’t go straight up and then straight down.
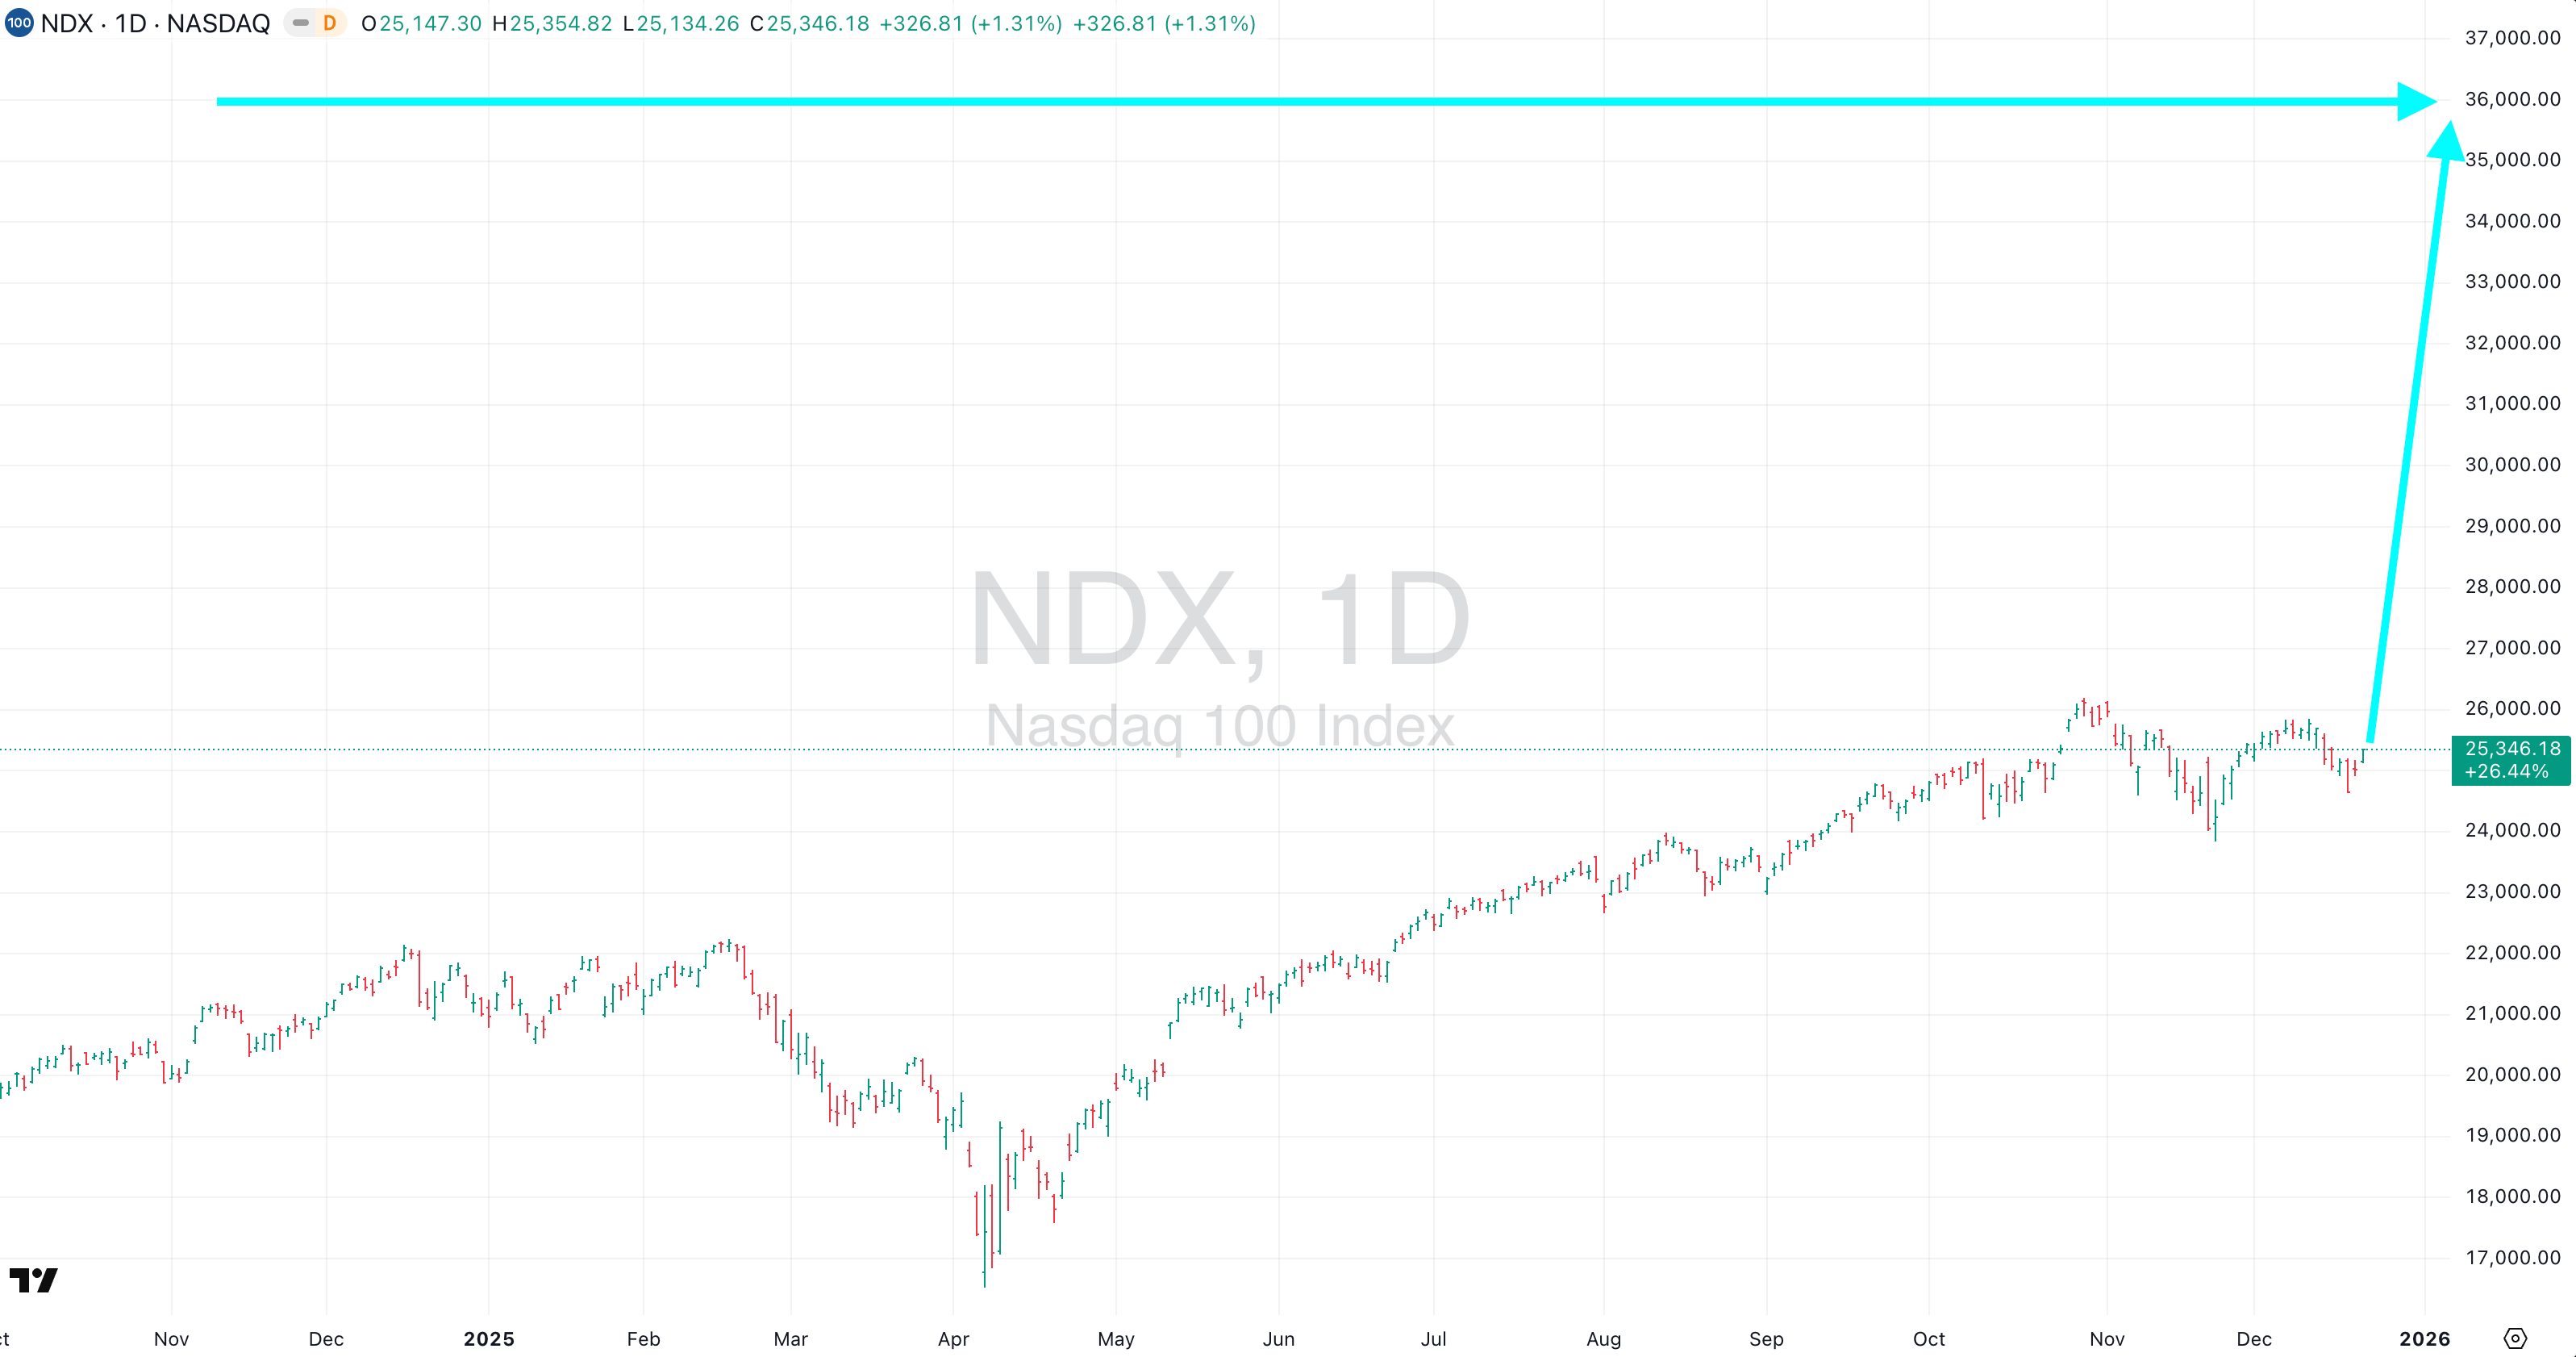
The NASDAQ actually has to get to about 36,000 to be officially in a bubble, so it’s got a long way to go to officially be in a bubble.
This is NDX 36,000:
The theme since October has been all about the wall of worry aka “The AI bubble.”
In Back To The Beginning I Perch Observations #19 I wrote:
It could simply be just there is a lot of headlines to retest:
The September high
The Oct 10th headline bomb
The China trade agreement headlines
The 1 or 2 rate cut headlines
The October high
Continuing to digest all of that is the most likely explanation for the last few month’s choppy price action. I think market technicians would see this as a flag and pennant pattern?
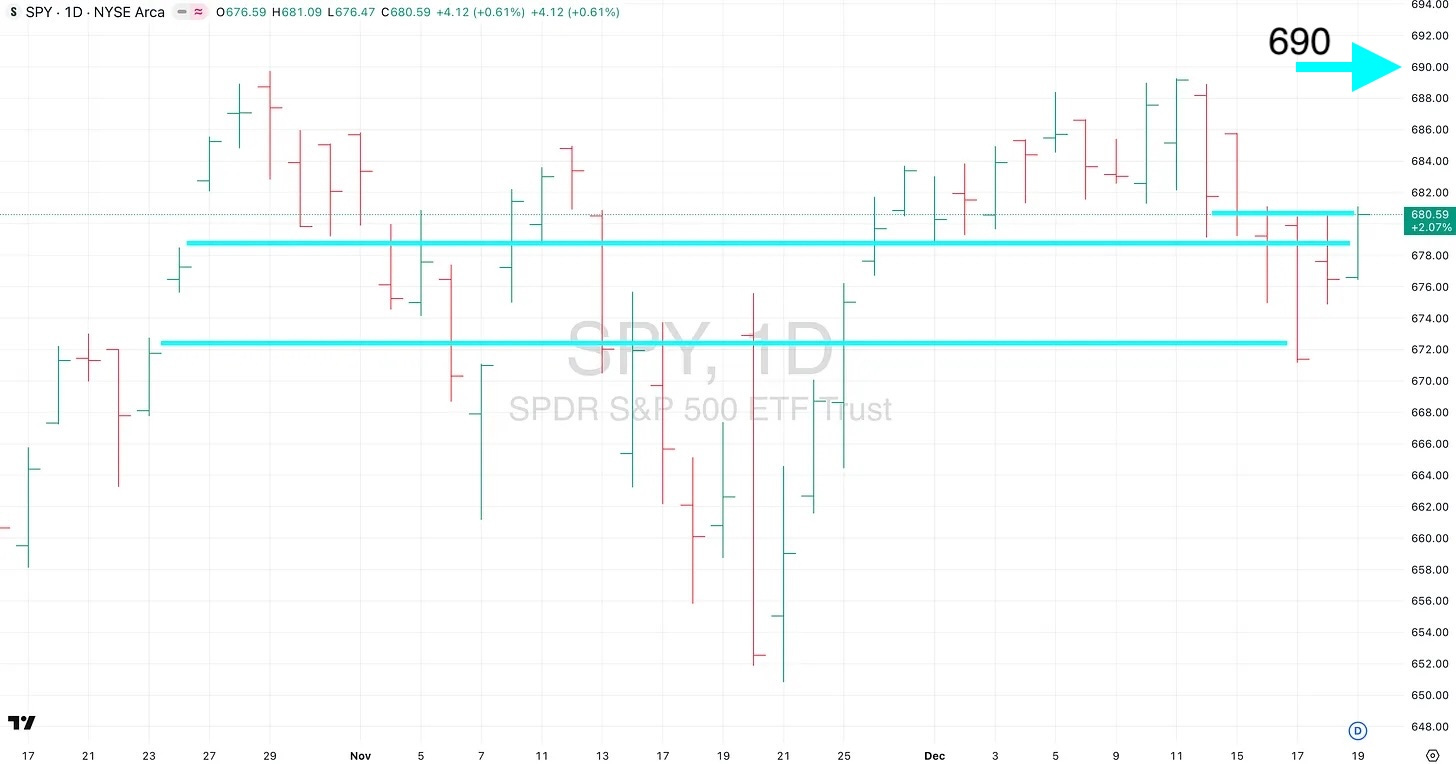
While not breaking above the all-time high set in October, December price action has set a higher high and higher low versus November’s. Intraweek, Wednesday proved to be a red herring because price ultimately ended where it was last Friday and at the Monday open. The gaps, again, showing their magnetism. The shorter-term price action continues to build upside momentum, and the longer time-frame uptrend remains intact.
The overall price action continues to show bullish signals, but failure to sustain above 690 would be the first sign of trouble for the bulls.
Markets are running on their usual holiday trading hours. If you need help developing an automated trading system so you can also take advantage of the shortened work week, here’s a guide to get you started: How To Build An Automated Trading System with ChatGPT + Interactive Brokers API.
May the market odds be ever in your favor, and Thank You! for supporting Little Bird Trading!
Disclaimer: Little Bird Trading and any of its associations may or may not, whether long or short, have a position in any instruments. Not investment advice. Provided for informational purposes only. Not a recommendation or endorsement. Not registered or licensed. Model portfolios are property of their respective owners. All data is sourced from publicly available information. No guarantee is being made or offered. Not responsible for financial loss or ruin.
Enjoying this content?
Subscribe on Substack