

Your Edge Starts With Fewer Lines: The Trendline Saturation Problem Most Traders Don’t Measure
You do not need more drawings. You need a cleaner decision surface that converts trendline insight into repeatable execution under live pressure.
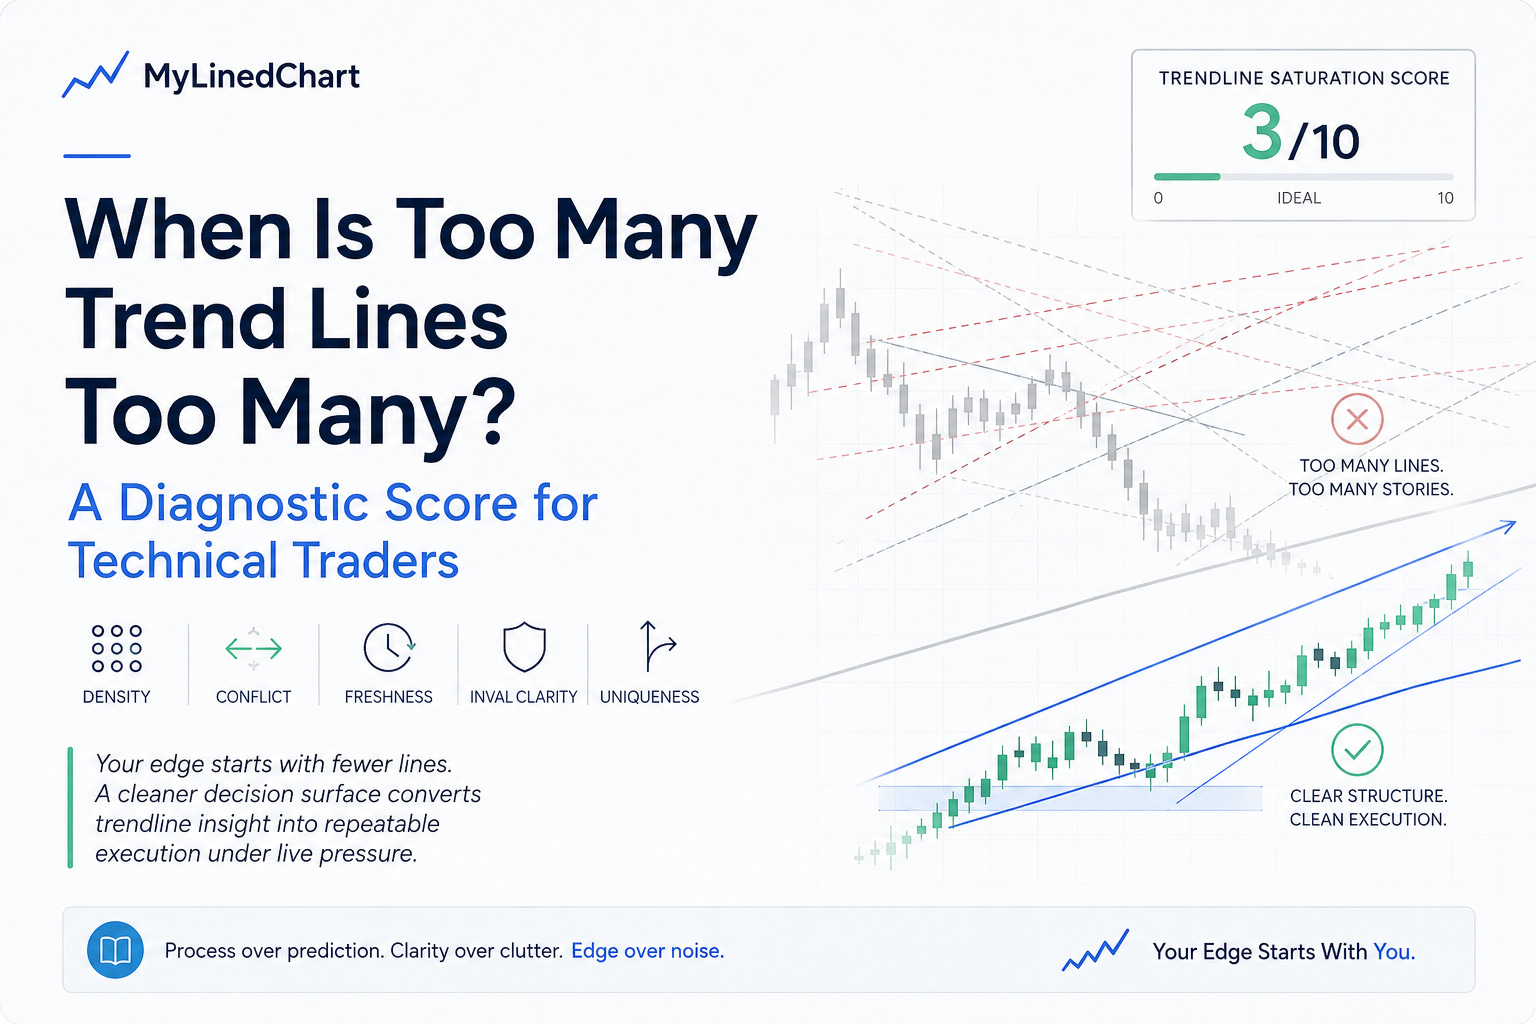
Originally published on MyLinedChart: When Is Too Many Trend Lines Too Many? A Diagnostic Score for Technical Traders
Get your first week of MyLinedChart for free. https://mylinedchart.com/
Most traders ask whether trendlines work. Fewer ask whether their current trendline state is executable. That distinction is where process quality either compounds or leaks.
You can be right about structure and still underperform because your chart has become an interpretation maze. When one area contains six diagonals, three micro-adjustments, and two conflicting narratives, your trigger is no longer a trigger. It is a debate.
Your edge starts with you, and your edge compounds when you reduce contradiction before risk. This is insight vs execution, memory vs structured context, signals vs process.
Core Problem: Trendline Density Quietly Degrades Execution
Line-heavy charting creates a hidden tax:
slower entries on valid setups,
more discretionary overrides,
post-trade rationalization instead of clean diagnosis.
When this happens, you are not running a line model. You are running a narrative model and calling it technical discipline.
If this sounds familiar, start with these operator-first references:
Your Edge Starts With You: How Traders Turn Good Reads Into Repeatable Results
Your Edge Starts With You, but the Data Layer Decides Whether It Actually Compounds
Framework: Run a Trendline Saturation Score Before You Trade
Use a pre-trade score to classify chart state quality, not just setup quality:
Density: How many active execution lines are near trigger?
Conflict: How many lines imply opposite decisions?
Freshness: How many lines are stale relative to current regime?
Inval clarity: Do you have one clear invalidation or three optional exits?
Uniqueness: Is there one trigger path or multiple interchangeable stories?
Then use a simple permission model:
0-4: trade-ready chart state
5-7: caution, reduce complexity first
8-10: mandatory cleanup before new risk
Operational Cadence: Keep, Archive, Ignore
Most traders have line-creation habits and no line-retirement policy. That is why clutter compounds.
Use a weekly lifecycle protocol:
Keep: recently validated lines with current trigger role
Archive: useful for review history, not live execution
Ignore/Delete: stale, duplicate, or narrative-only lines
This is where you shift from chart art to operator process.
Execution Rule: Split Context Lines from Execution Lines
One chart usually does two jobs. If you merge both jobs in one unmanaged layer, you increase branch entropy.
Context layer: structural memory only
Execution layer: active triggers only
Promotion rule: context lines become execution lines only after fresh revalidation
Use these deeper implementation guides:
The Two-Layer Trendline System: Keep Context Lines, Cut Execution Noise
Trendline Shelf-Life: When Old Lines Stop Carrying Edge in Live Markets
The Trendline Deletion Protocol: What to Keep, What to Archive, What to Ignore
7-Day Starter Sprint
Day 1: score current chart state before each setup.
Day 2-5: cap execution lines per instrument and log all conflict-driven passes.
Day 6: run a saturation audit across the week.
Day 7: deploy one cleanup rule only for next week.
Do not optimize everything at once. One rule per cycle keeps attribution clear and compounding real.
Closing Thesis
Trendline trading does not fail because lines are invalid tools. It fails when line-state governance is missing.
A cleaner chart is not simplification theater. It is execution infrastructure. Your edge starts with you, and it compounds when your decision surface is strict enough to survive speed, pressure, and variance.
If you want the full 10-article operating series for this theme, start in the MyLinedChart Articles hub: https://mylinedchart.com/resources/articles.
Originally published on MyLinedChart: When Is Too Many Trend Lines Too Many? A Diagnostic Score for Technical Traders
Get your first week of MyLinedChart for free.
https://mylinedchart.com/
Enjoying this content?
Subscribe on Substack