

SPY, DAX +18 Global Market Levels: Sept 28-Oct 2 Week in Review and Chart Pack
SPY, QQQ and 19 stock markets across Asia, Europe and the Americas, level by level
See the latest daily SPY, ES, QQQ & NQ levels, posted the evening before the next day's session.
Get each market's levels in real time as they're posted. Sign up on Little Bird Trading.
MyLinedChart turns your technical analysis into trading rules. Draw your levels, export your entire chart to XLSX, and turn your rules into trades. Or, have Claude, Codex, or Cursor do the work for you.
A mixed week across the US, Asia, Europe and Latin America: 9 of 23 finished higher, with the week's low on Thursday, October 1.
US
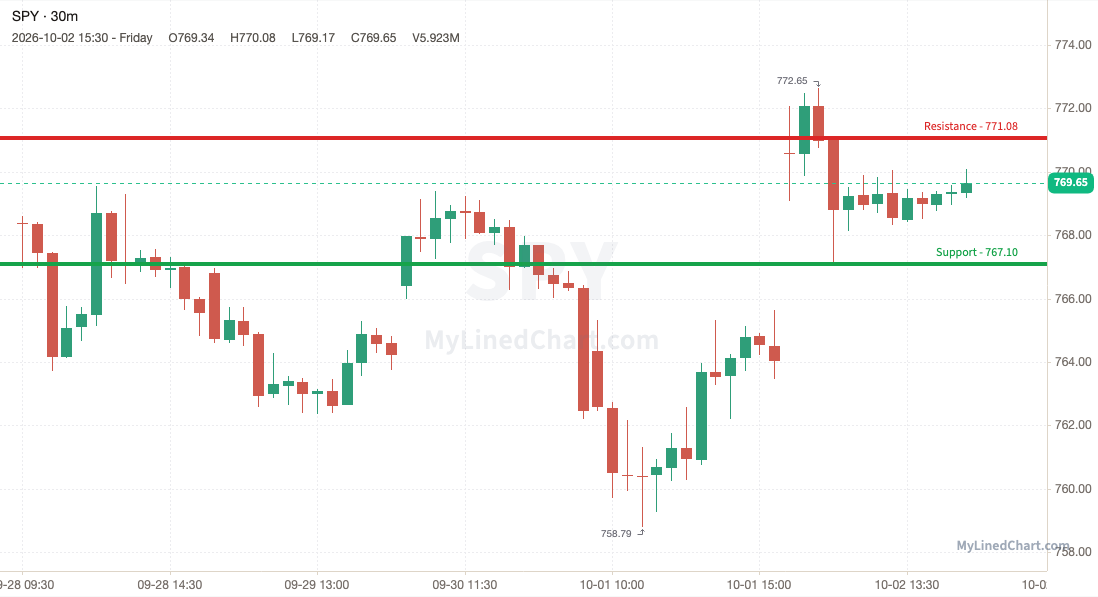
SPY (S&P 500 ETF) +0.17% 768.38 → 769.65
Buyers had to work for it: SPY flushed to 758.79, below the 767.10 support, then reclaimed the level and closed at 769.65, in the middle of its range.
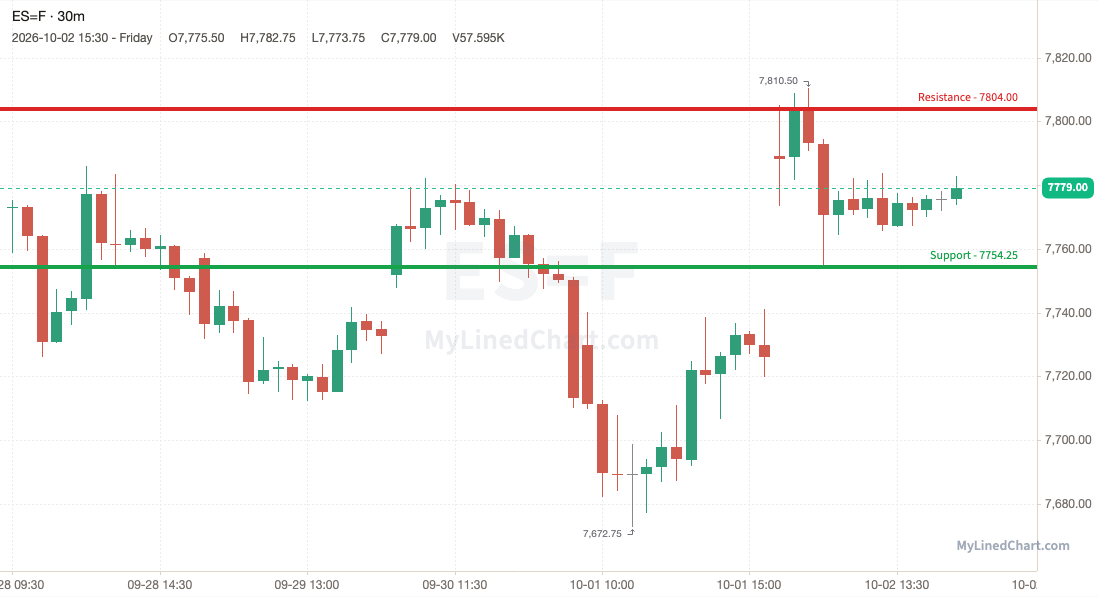
ES (E-mini S&P 500 futures) +0.04% 7772.75 → 7775.75
ES lost 7754.25 intraday on a dip to 7672.75, but clawed it all back to finish at 7775.75, around the middle of its weekly range.
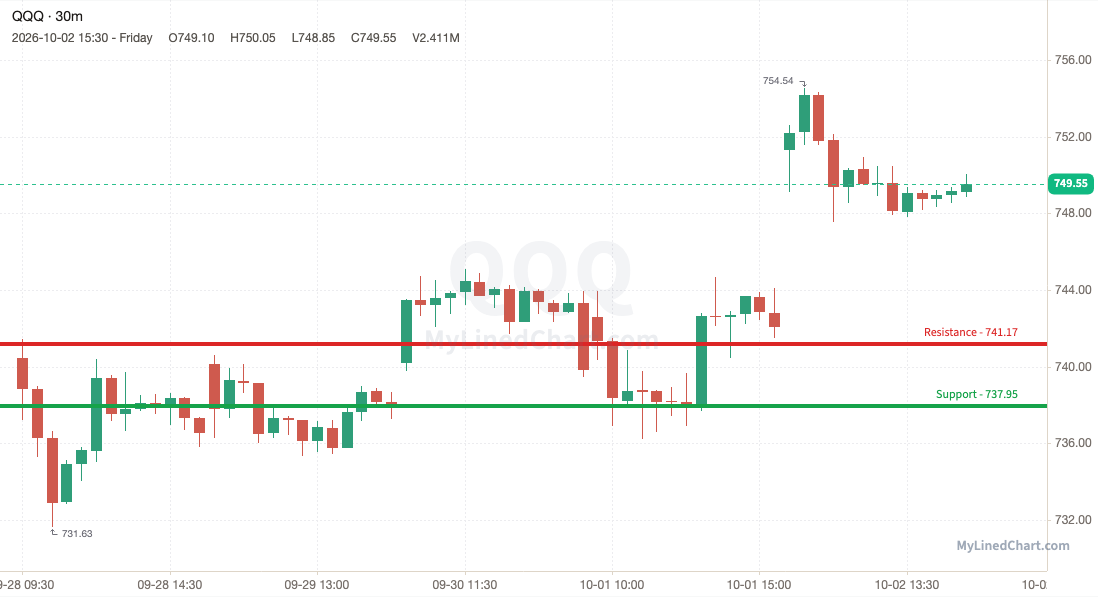
QQQ (Nasdaq 100 ETF) +1.23% 740.46 → 749.55
A midweek shakeout dragged QQQ down to 731.63 beneath 737.95 before it recovered the line and settled at 749.55, mid-range for the week.
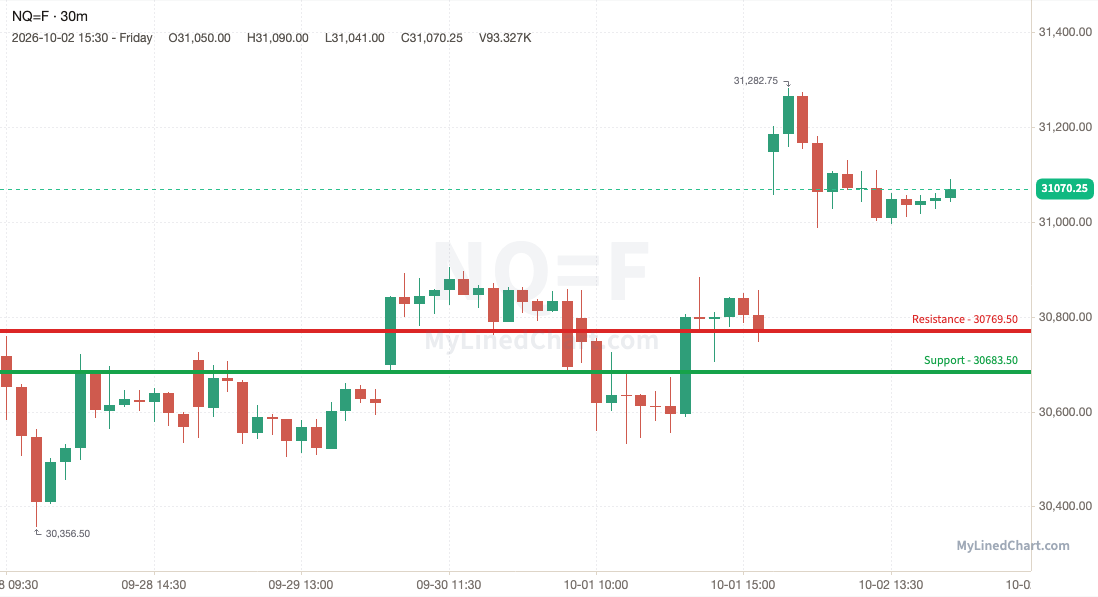
NQ (E-mini Nasdaq 100 futures) +1.08% 30717.75 → 31049.75
NQ dipped under 30683.50 to 30356.50, then bought back up to close the week at 31049.75, in the middle of its range.
See the SPY, ES, QQQ & NQ trade plan
Asia
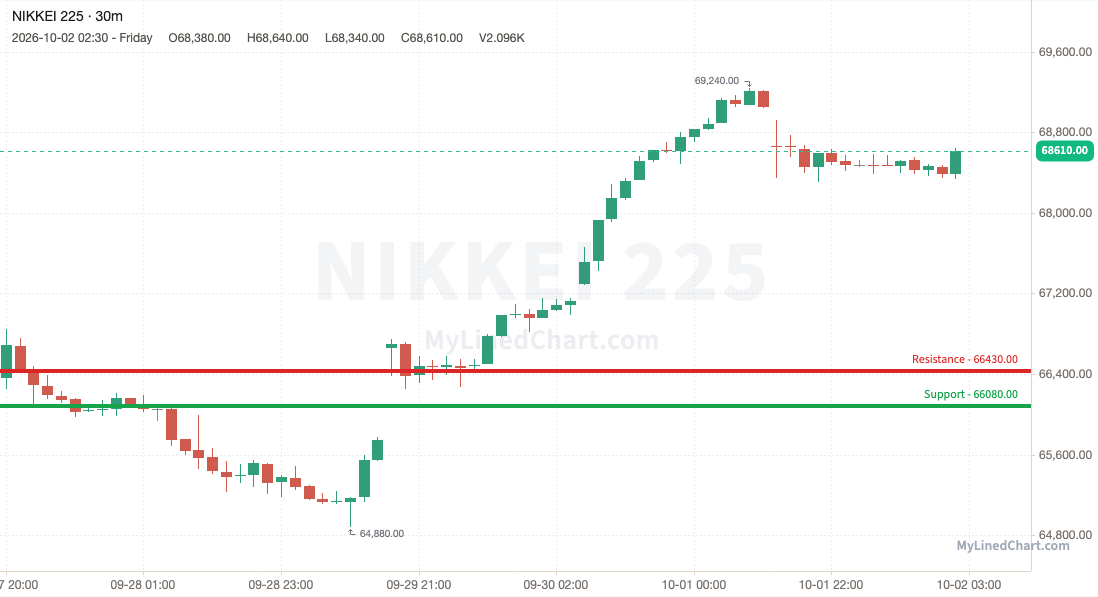
Nikkei 225 (Japan) +3.39% 66360 → 68610
Buyers had to work for it: Nikkei 225 flushed to 64880, below the 66080 support, then reclaimed the level and closed at 68610, at the top of its weekly range.
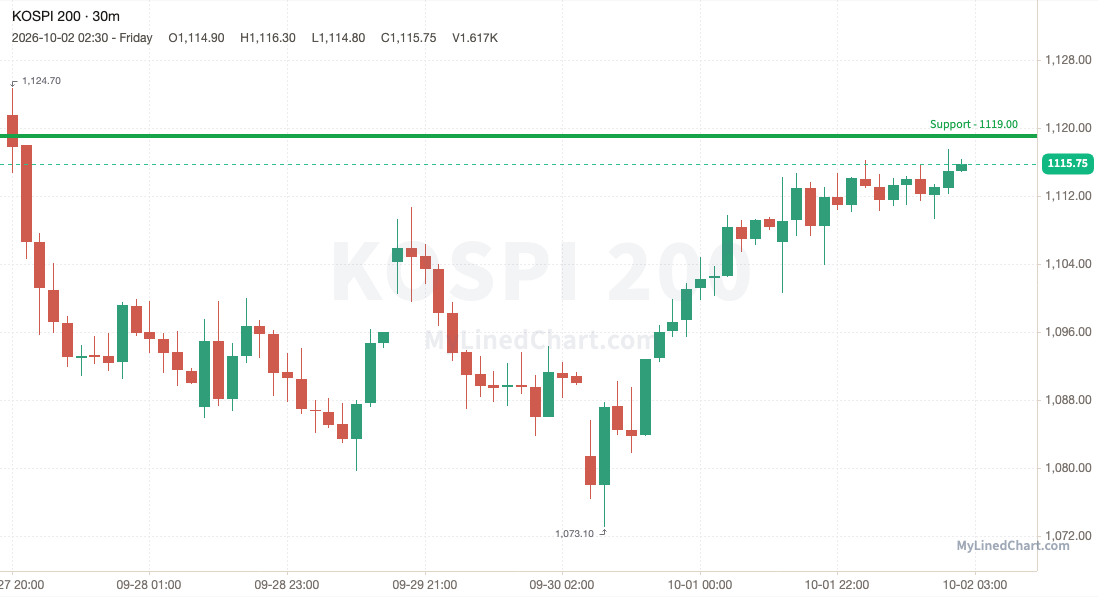
KOSPI 200 (Korea) -0.51% 1121.50 → 1115.75
KOSPI 200 broke the 1119 support and couldn't get back above it, closing at 1115.75, near the week's high.
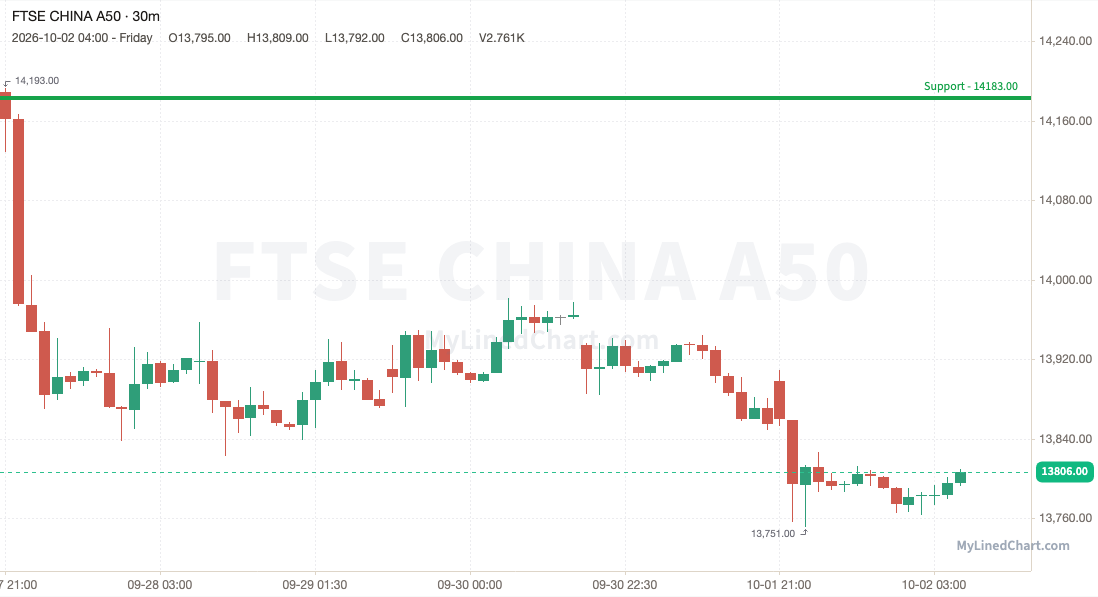
FTSE China A50 (China) -2.70% 14189 → 13806
FTSE China A50 lost 14183 and stayed under it, ending the week at 13806, down at the lows.
See the FTSE China A50 trade plan
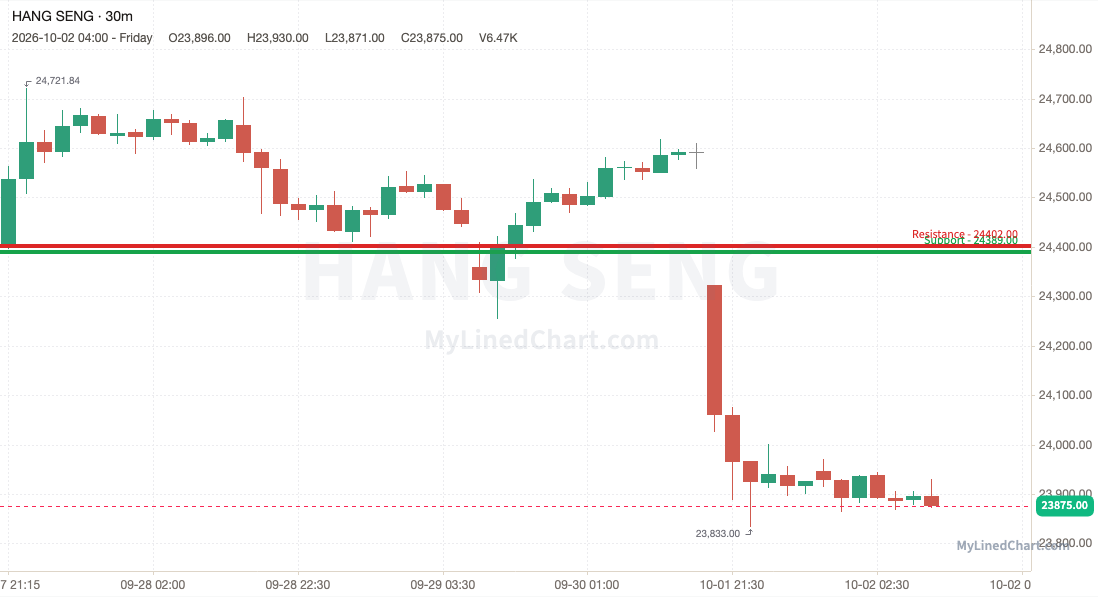
Hang Seng (Hong Kong) -2.16% 24401.61 → 23875
The 24389 support gave way for Hang Seng, which closed below it at 23875, at the bottom of its weekly range.
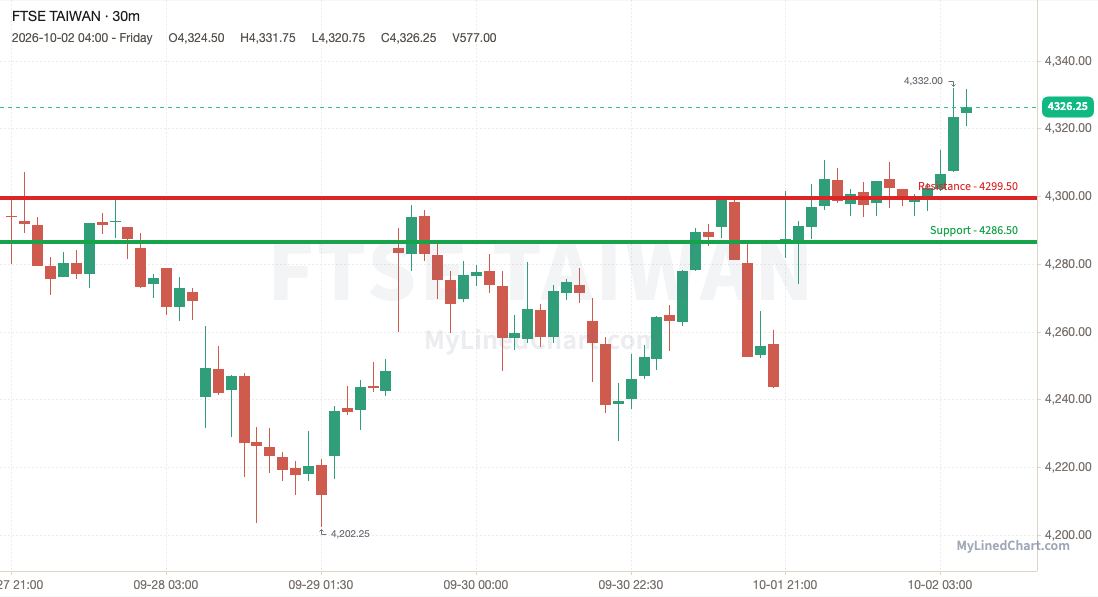
FTSE Taiwan (Taiwan) +0.75% 4294.25 → 4326.25
Buyers had to work for it: FTSE Taiwan flushed to 4202.25, below the 4286.50 support, then reclaimed the level and closed at 4326.25, near the week's high.
See the FTSE Taiwan trade plan
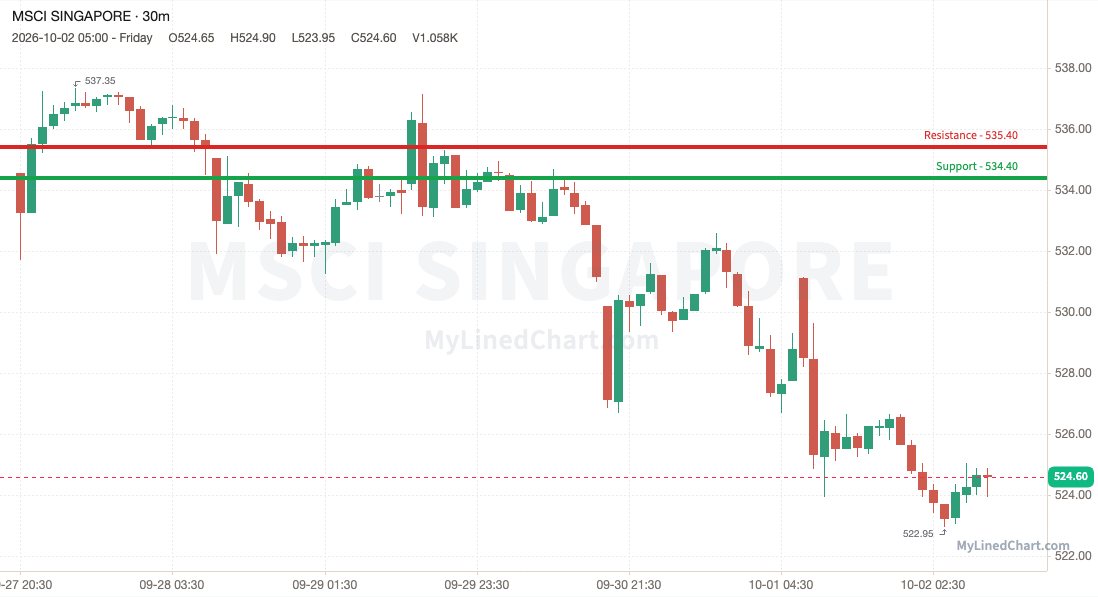
MSCI Singapore (Singapore) -1.86% 534.55 → 524.60
MSCI Singapore lost 534.40 and stayed under it, ending the week at 524.60, down at the lows.
See the MSCI Singapore trade plan
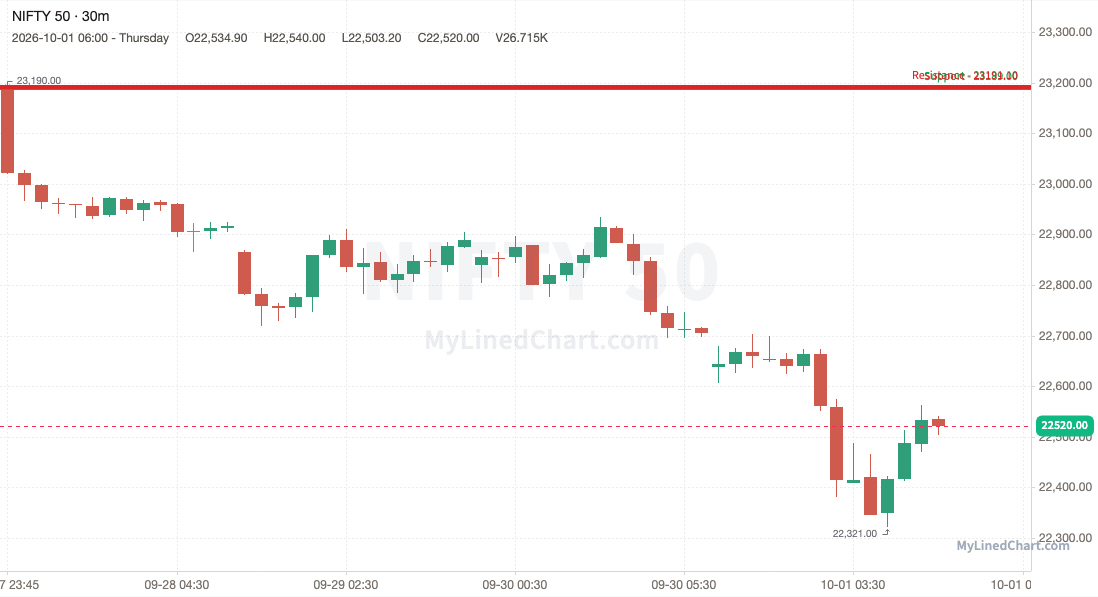
NIFTY 50 (India) -2.89% 23190 → 22520
The 23189 support gave way for NIFTY 50, which closed below it at 22520, around the middle of its weekly range.
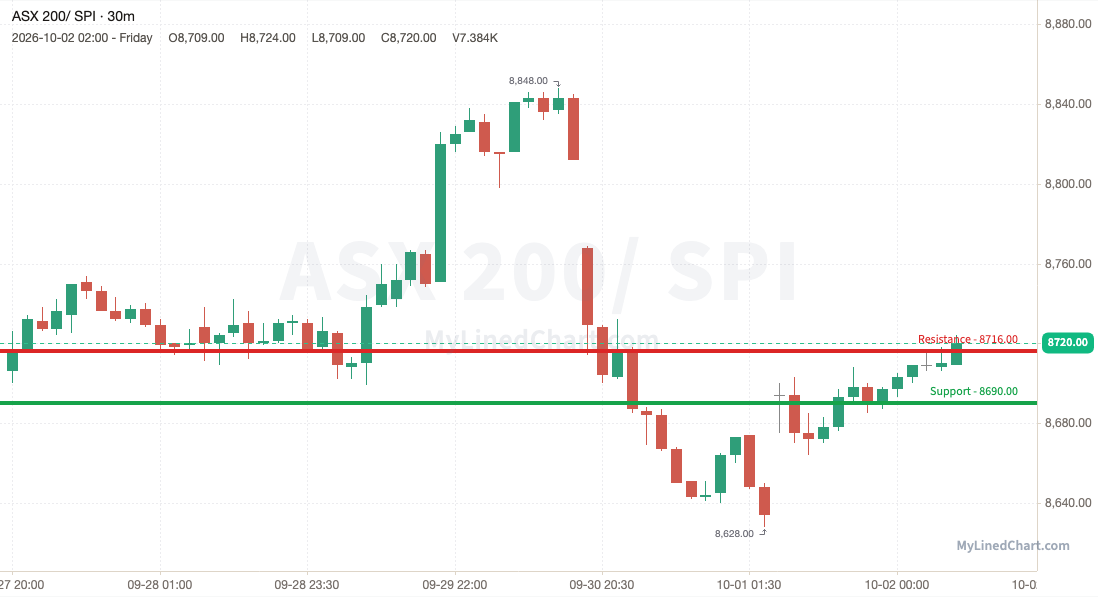
ASX 200 / SPI (Australia) +0.16% 8706 → 8720
SPI dipped under 8690 to 8628, then bought back up to close the week at 8720, mid-range for the week.
Europe
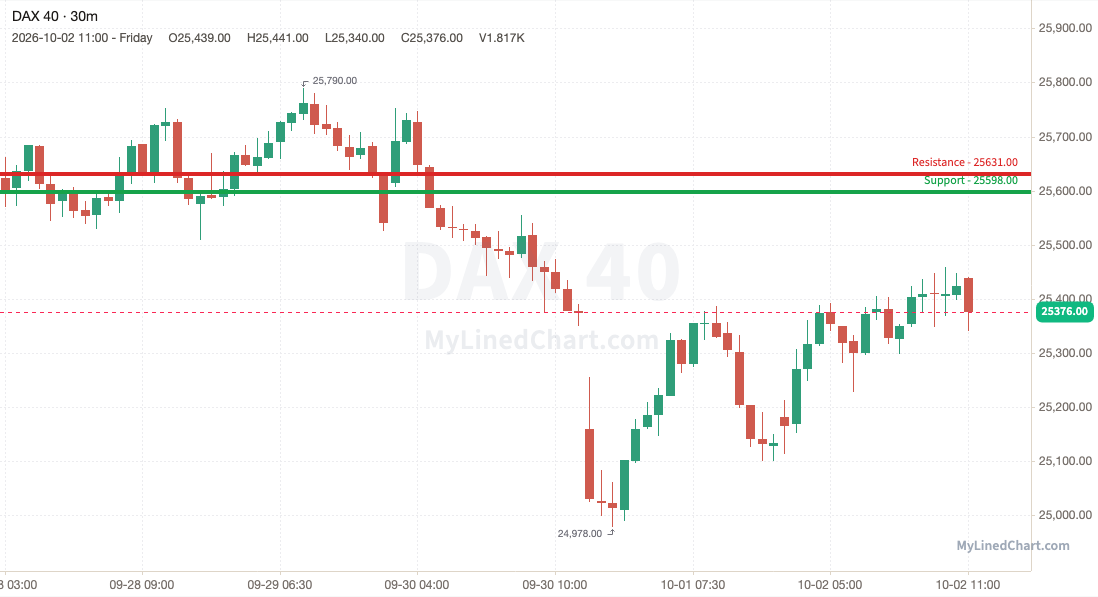
DAX 40 (Germany) -0.97% 25624 → 25376
DAX 40 lost 25598 and stayed under it, ending the week at 25376, in the middle of its range.
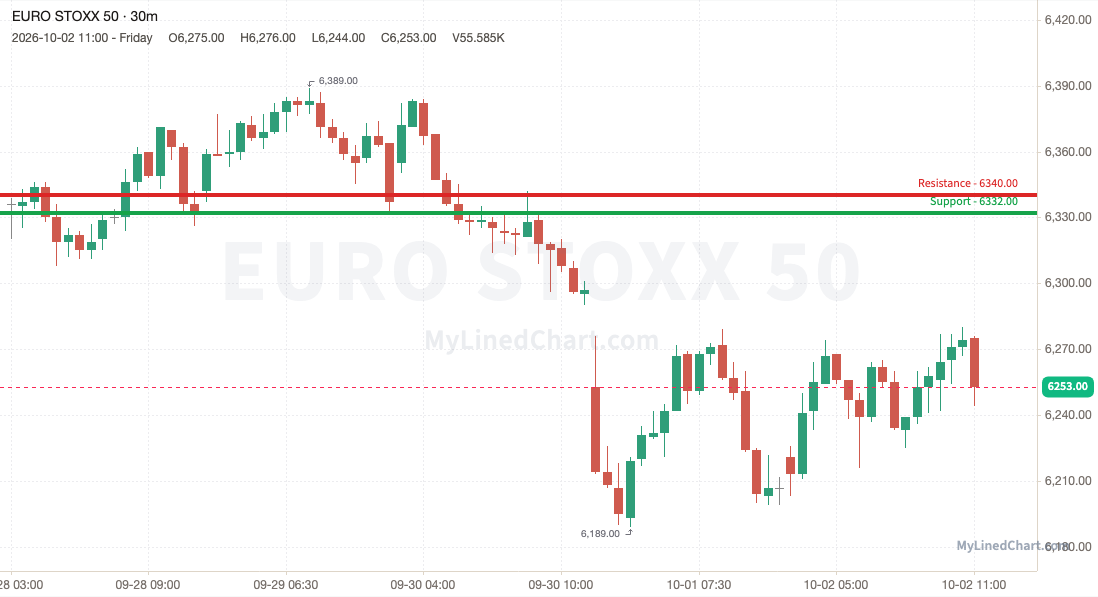
Euro Stoxx 50 (Eurozone) -1.31% 6336 → 6253
The 6332 support gave way for Euro Stoxx 50, which closed below it at 6253, around the middle of its weekly range.
See the Euro Stoxx 50 trade plan
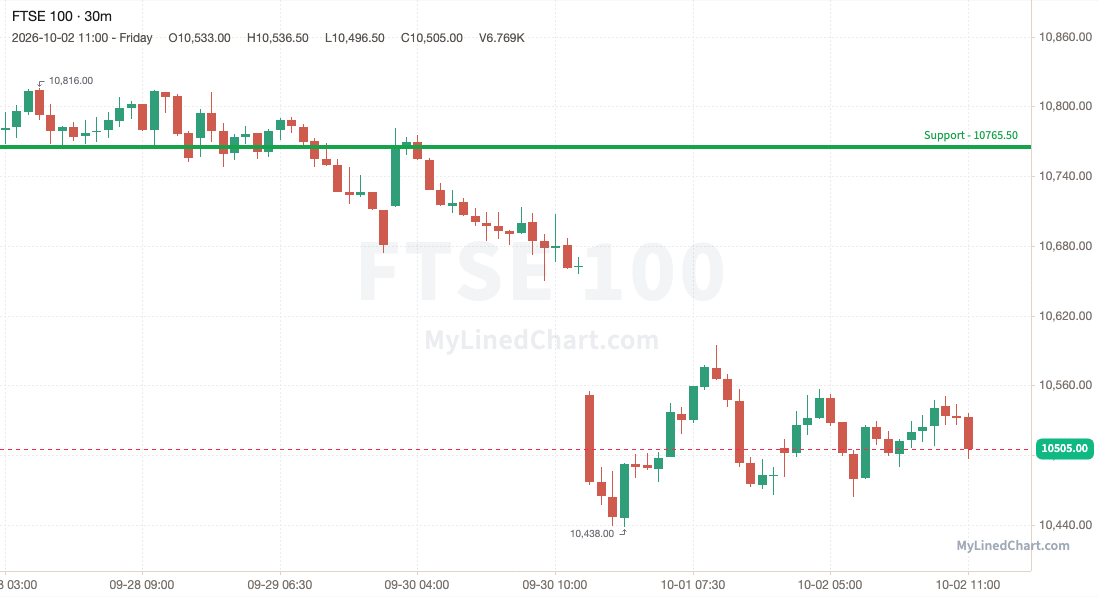
FTSE 100 (UK) -2.55% 10780 → 10505
FTSE 100 broke the 10765.50 support and couldn't get back above it, closing at 10505, near the week's low.
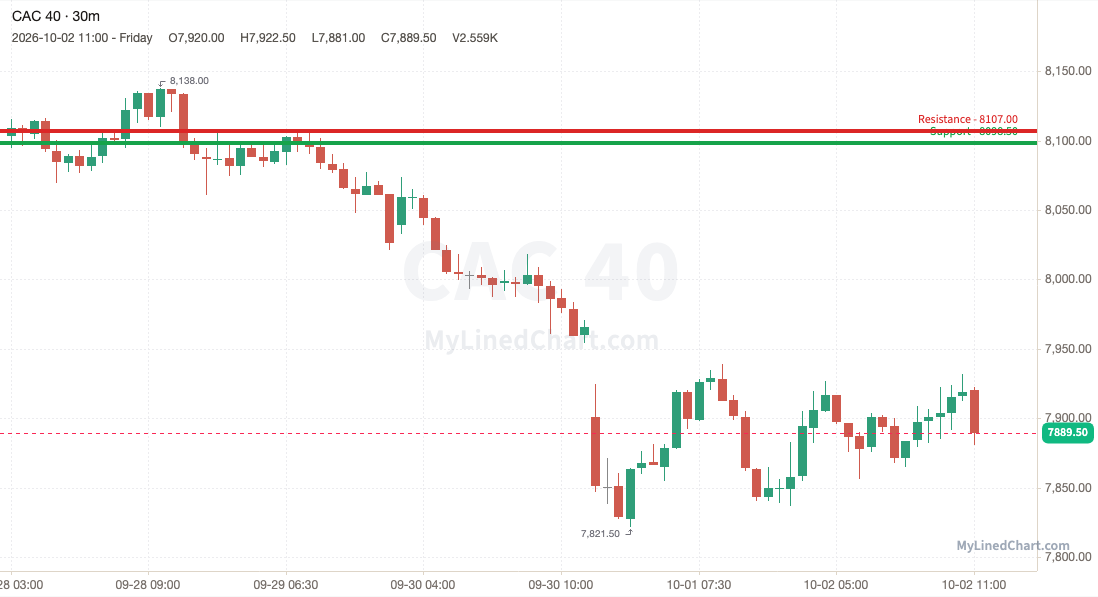
CAC 40 (France) -2.63% 8103 → 7889.50
CAC 40 lost 8098.50 and stayed under it, ending the week at 7889.50, in the middle of its range.
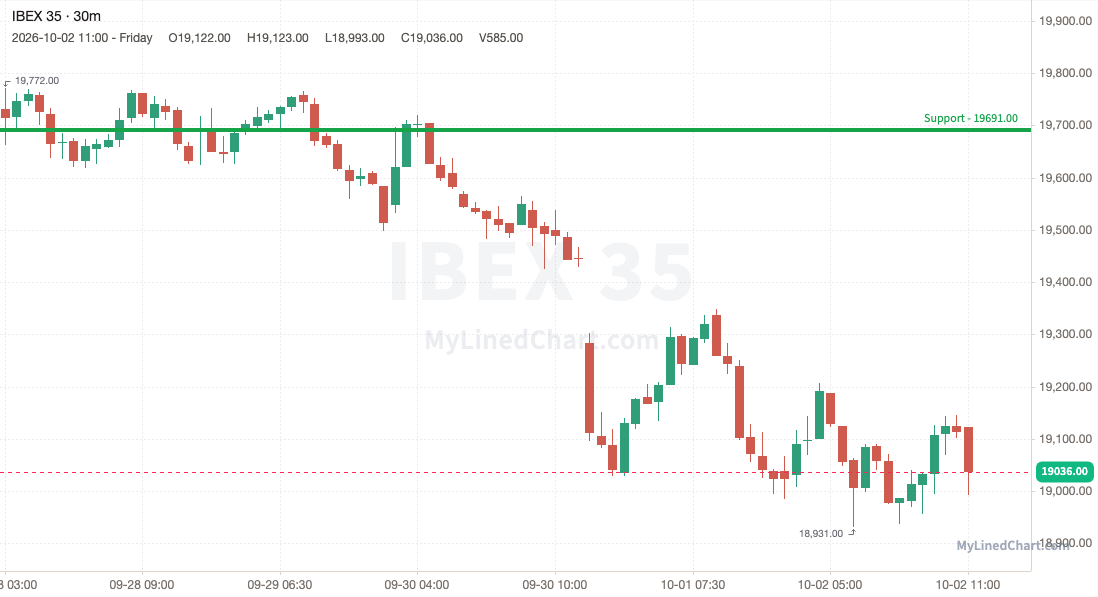
IBEX 35 (Spain) -3.52% 19731 → 19036
The 19691 support gave way for IBEX 35, which closed below it at 19036, at the bottom of its weekly range.
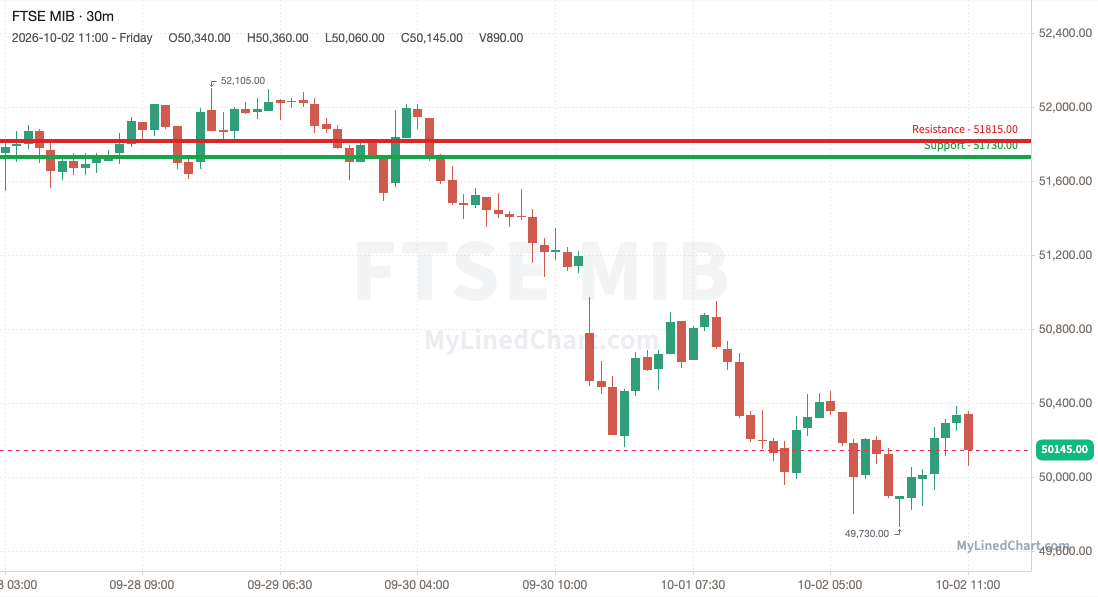
FTSE MIB (Italy) -3.11% 51755 → 50145
FTSE MIB broke the 51730 support and couldn't get back above it, closing at 50145, near the week's low.
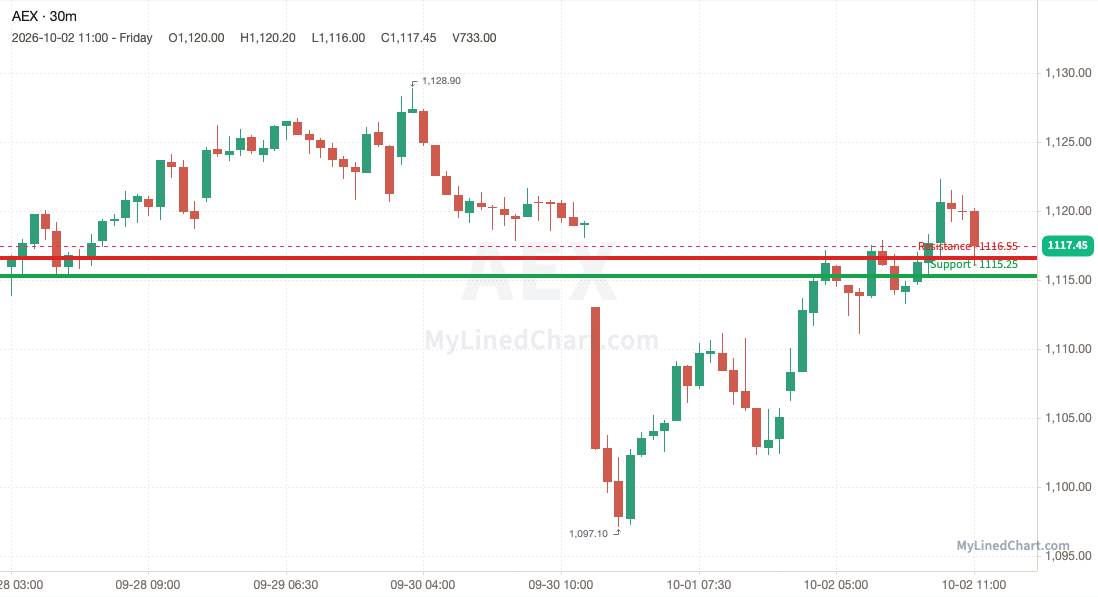
AEX (Netherlands) +0.14% 1115.90 → 1117.45
A midweek shakeout dragged AEX down to 1097.10 beneath 1115.25 before it recovered the line and settled at 1117.45, in the middle of its range.
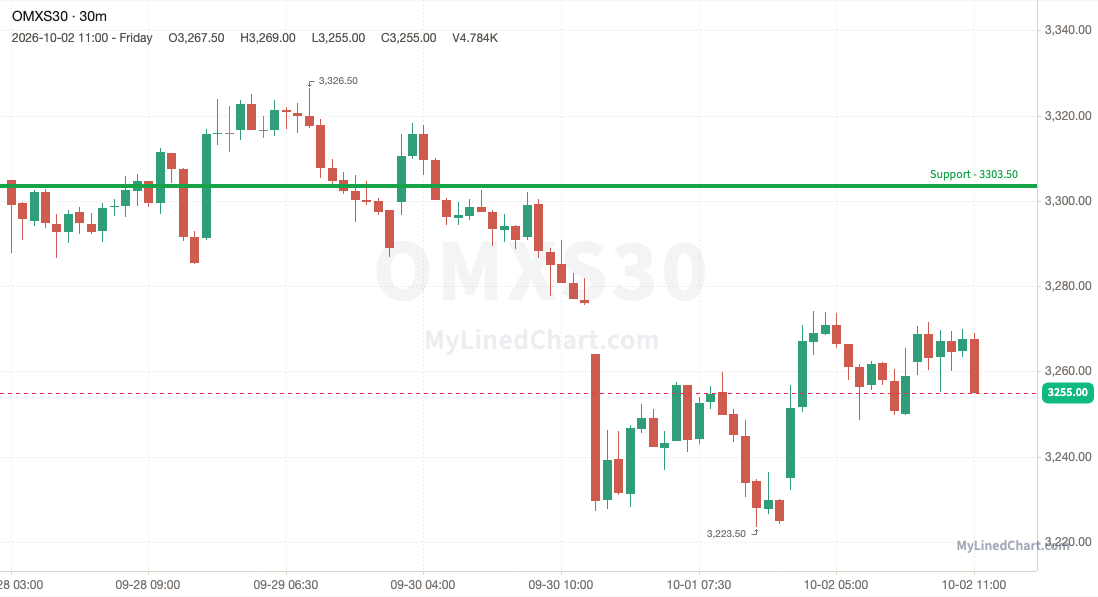
OMXS30 (Sweden) -1.51% 3305 → 3255
The 3303.50 support gave way for OMXS30, which closed below it at 3255, around the middle of its weekly range.
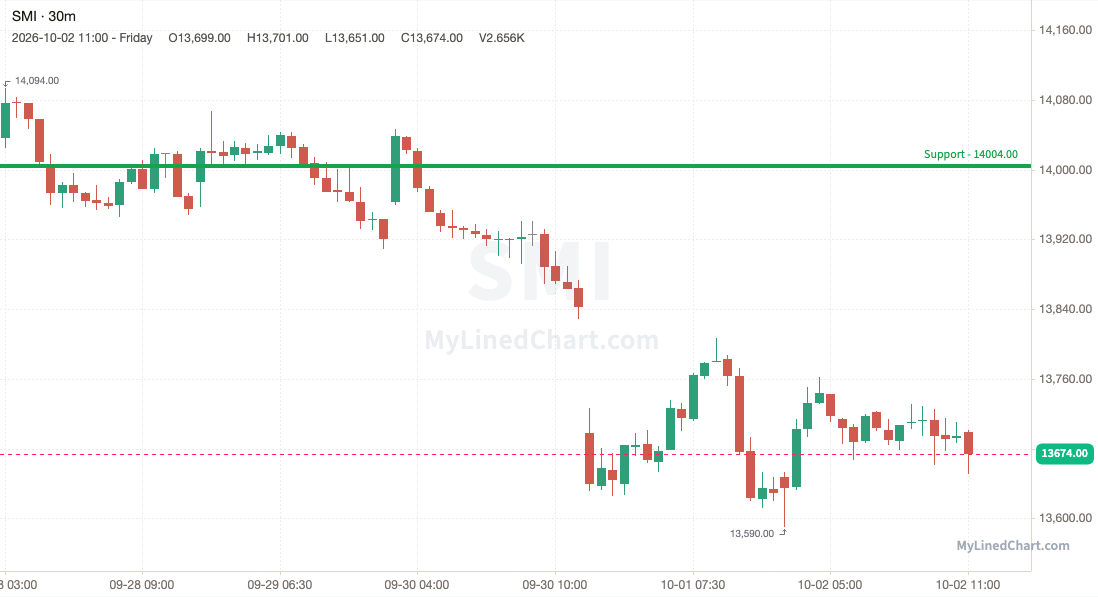
SMI (Switzerland) -2.59% 14037 → 13674
SMI broke the 14004 support and couldn't get back above it, closing at 13674, near the week's low.
Latin America
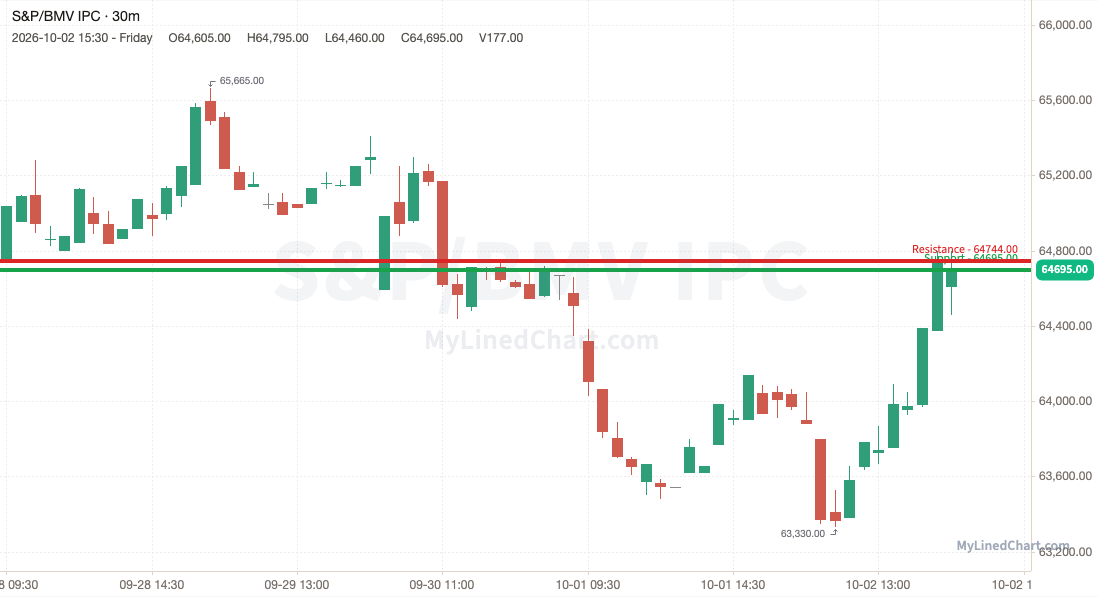
S&P/BMV IPC (Mexico) -0.06% 64735 → 64695
S&P/BMV IPC lost 64695 intraday on a dip to 63330, but clawed it all back to finish at 64695, in the middle of its range.
See the S&P/BMV IPC trade plan
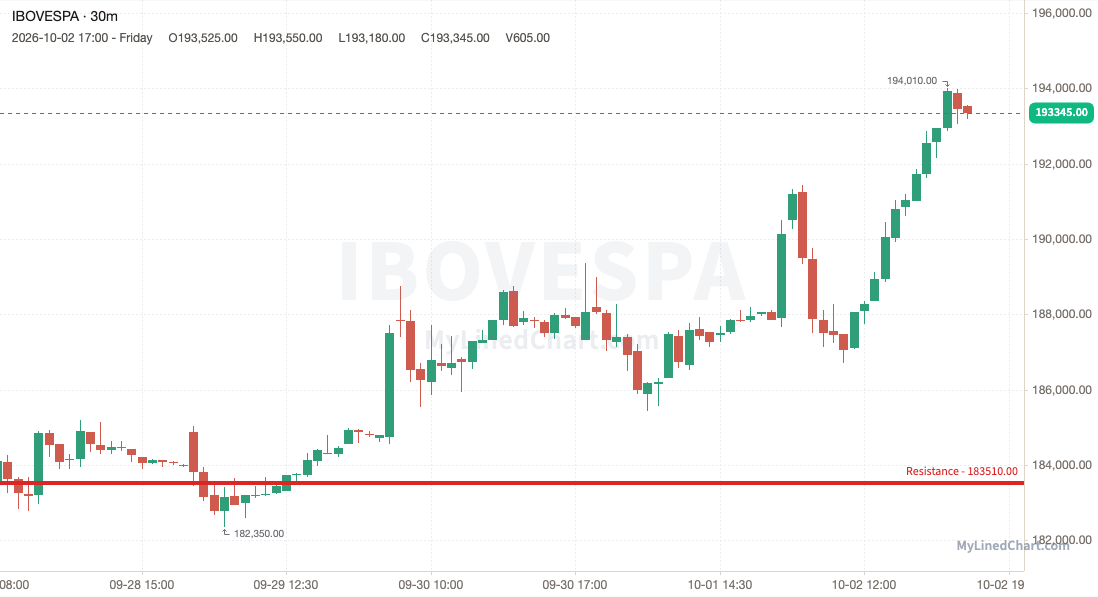
Ibovespa (Brazil) +5.37% 183500 → 193345
Ibovespa opened the week under every level published and closed at 193345, at the top of its weekly range.
Busiest levels this week:
Ibovespa 188065: most volume, 1934 contracts, touched 10 times
Ibovespa 188180: 2nd most, 1265 contracts, touched 3 times
Ibovespa 191255: 3rd most, 971 contracts, touched 4 times
Touches show how often traders defended a price; each test can wear it down. Volume shows how much trading happened there, and heavy-volume prices tend to pull price back because many traders hold positions there.
Get each market's levels in real time as they're posted. Sign up on Little Bird Trading.
Pro: next-session levels for the markets you trade, on Little Bird Trading.
Disclaimer: Little Bird Trading and any of its associations may or may not, whether long or short, have a position in any instruments. Not investment advice. Provided for informational purposes only. Not a recommendation or endorsement. Not registered or licensed. All data is sourced from publicly available information. No guarantee is being made or offered. Not responsible for financial loss or ruin.
Enjoying this content?
Subscribe on Substack